http://www.bimarket.cn/Report/ReportInfo.aspx?Id=26050
DESCRIPTION
Visiongain assesses that spending on armoured vehicles will reach $13.36bn in 2016. It is therefore critical that your strategic planning is timely and your forecasting plans are in place to take advantage of the market.
Visiongain's report will ensure that you keep informed and ahead of your competitors. Gain that competitive advantage.
The report will answer questions such as:
What are the prospects for the overall Armoured Vehicles industry?
How profitable is the Armoured Vehicles industry?
Who are the key players in the Armoured Vehicles industry?
What are the demand and supply dynamics underpinning the Armoured Vehicles sector?
How consolidated is the sector amongst the Armoured Vehicles industry players?
How will you benefit from this report?
This report you will keep your knowledge base up to speed. Don't get left behind
This report will allow you to reinforce strategic decision decision-making based upon definitive and reliable market data
You will learn how to exploit new technological trends
You will be able to realise your company's full potential within the market
You will better understand the competitive landscape and identify potential new business opportunities & partnerships
5 Reasons why you must order and read this report today:
1) The report provides detailed profiles of 8 leading companies operating within the armoured vehicles market:
AM General
BAE Systems
General Dynamics Corporation
Navistar International Corporation
Oshkosh Corporation
Rheinmetall AG
Textron Inc.
Thales Group
2) The study reveals where and how companies are investing in armoured vehicles. We show you the prospects for the following national markets:
Australia
Canada
China
France
Germany
India
Israel
Italy
Japan
Russia
Saudi Arabia
South Korea
United Kingdom
United States
The Rest of World market includes information about a further 6 national markets.
3) Our overview also forecasts and analyses these armoured vehicle submarkets from 2016-2026
Main Battle Tanks (MBT)
Medium Armoured Vehicles (MAV)
Light Protected Vehicles (LPV)
Other Armoured Vehicles
4) 125 armoured vehicle contracts, programmes are analysed for the following vehicle types in this report
Armoured Combat Vehicle (ACV)
Armoured Fighting Vehicle (AFV)
Armoured Multipurpose Vehicle (AMPV)
Armoured Personnel Carrier (APC)
Australian Light Armoured Vehicle (ASLAV)
Blast Resistant Vehicle-Offroad (BRV-O)
Close Combat Vehicle (CCV)
Combat Reconnaissance Vehicles (CRV)
Double V-Hull (DVH)
Future Fighting Vehicle (FFV)
Future Infantry Combat Vehicles (FICV)
Ground Combat Vehicle (GCV)
Heavy Armoured Personnel Carrier (HAPC)
Heavy Expanded Mobility Tactical Truck (HEMITT)
Heavy Equipment Transporter (HET)
High-Mobility Multipurpose Wheeled Vehicle (HMMWV)
Infantry Carrier Vehicle (ICV)
Infantry Fighting Vehicle (IFV)
International Light Armoured Vehicle (ILAV)
Joint Light Tactical Vehicle (JLTV)
Land Combat Vehicle System (LCVS)
Light Protected Patrol Vehicle (LPPV)
Light Protected Vehicles (LPV)
Main Battle Tanks (MBT)
Medium Armoured Security Vehicles (MASV)
Medium Armoured Vehicles (MAV)
MRAP All-Terrain Vehicle (M-ATV)
Modernized Light Tactical Vehicle (MLTV)
Marine Personnel Carrier (MPC)
Mobile Strike Force Vehicle (MSFV)
Protected Mobility Vehicle-Light (PMV-L)
Tactical Armoured Patrol Vehicle (TAPV)
5) SWOT analysis examining the armoured vehicles market
Competitive advantage
This independent 242 page report guarantees you will remain better informed than your competitors. With 240 tables and figures examining the Armoured Vehicles market space, the report gives you an immediate, one-stop breakdown of your market. PLUS national market forecasts, as well as analysis, from 2016-2026 keeping your knowledge that one step ahead of your rivals.
Who should read this report?
Anyone within the Armoured Vehicles market value chain.
CEO's
COO's
CIO's
Business development managers
Marketing managers
Technologists
Suppliers
Investors
Banks
Government agencies
Contractors
Don't miss out
This report is essential reading for you or anyone in the Armoured Vehicles sector with an interest in Armoured Vehicles. Purchasing this report today will help you to recognise those important market opportunities and understand the possibilities there. Order Military Armoured Vehicle Market Report 2016-2026: Forecasts for Main Battle Tanks (MBT), Medium Armoured Vehicles (MAV), Light Protected Vehicles (LPV), Mine-Resistant Ambush-Protected (MRAP) Vehicles & Other Armoured Vehicles (AV). Contracts For (ACV, AFV, AMPV, APC, ASLAV, BRV-O, CCV, CRV, DVH, FFV, FICV, GCV, HAPC, HEMITT, HET, HMMWV, ICV, IFV, ILAV, JLTV, LCVS, LPPV, MASV, M-ATV, MLTV, MPC, MSFV, PMV-L, TAPV) Programmes & Technologies report now. We look forward to receiving your order.
visiongain is a trading partner with the US Federal Government.
Table of Contents
1. Report Overview
1.1. Global Armoured Vehicle Market Overview
1.2. Why You Should Read This Report
1.3. How This Report Delivers
1.4. Key Questions Answered by This Analytical Report Include:
1.5. Who is This Report For?
1.6. Methodology
1.6.1. Research
1.6.2. Market Evaluation & Forecasting Methodology
1.7. Frequently Asked Questions (FAQ)
1.8. Associated visiongain Reports
1.9. About visiongain
2. Introduction to the Armoured Vehicles Market
2.1. Global Armoured Vehicle Market Structure
2.2. Armoured Vehicle Market Definition
2.3. Main Battle Tank (MBT) Submarket Definition
2.4. Medium Armoured Vehicle (MAV) Submarket Definition
2.5. Light Protected Vehicle (LPV) Submarket Definition
2.6. Mine-Resistant Ambush-Protected (MRAP) Vehicle Submarket Definition
2.7. Other Armoured Vehicle (AV) Submarket Definition
3. Global Armoured Vehicle Market 2016-2026
3.1. Global Armoured Vehicle Market Forecast 2016-2026
4. Global Armoured Vehicle Submarket Forecast 2016-2026
4.1. Global Main Battle Tank Submarket Forecast 2016-2026
4.2. Global Medium Armoured Vehicle Submarket Forecast 2016-2026
4.3. Global Light Protected Vehicle Submarket Forecast 2016-2026
4.4. Global Mine-Resistant Ambush-Protected Vehicle Submarket Forecast 2016-2026
4.5. Global Other Armoured Vehicles Submarket Forecast 2016-2026
4.6. Global Armoured Vehicle Submarket Cumulative Market Share Forecast 2016-2026
5. Leading National Armoured Vehicle Market Forecast 2016-2026
5.1. Leading National Armoured Vehicle Market Share Forecast 2016-2026
5.2. Australian Armoured Vehicle Market Forecast 2016-2026
5.2.1. Australian Armoured Vehicle Market Contracts & Programmes
5.2.2. Australian Armoured Vehicle Market Analysis
5.2.2.1. Combat Reconnaissance Vehicle (CRV)
5.2.2.2. Bushmaster Protected Mobility Vehicle (PMV)
5.2.3. Australian Armoured Vehicle Technologies Market Drivers & Restraints
5.3. Canadian Armoured Vehicle Market Forecast 2016-2026
5.3.1. Canadian Armoured Vehicle Market Contracts & Programmes
5.3.2. Canadian Armoured Vehicle Market Analysis
5.3.3. Canadian Armoured Vehicle Market Drivers & Restraints
5.4. Chinese Armoured Vehicle Market Forecast 2016-2026
5.4.1. Chinese Armoured Vehicle Market Analysis
5.4.1.1. ZTZ99 and Newer A2
5.4.1.2. ZTZ96 MBT Upgrades
5.4.1.3. ZBD97 Tracked Armoured Vehicle
5.4.1.4. ZLC2000 Light Vehicle
5.4.2. China's Economy as a Driver of the Armoured Vehicle Market
5.4.3. Beware of Chinese Dragons: A Caveat for Investors
5.4.4. Chinese Armoured Vehicle Market Drivers & Restraints
5.5. French Armoured Vehicle Market Forecast 2016-2026
5.5.1. French Armoured Vehicle Market Contracts & Programmes
5.5.2. French Armoured Vehicle Market Analysis
5.5.3. French Armoured Vehicle Market Drivers & Restraints
5.6. German Armoured Vehicle Market Forecast 2016-2026
5.6.1. German Armoured Vehicle Market Contracts & Programmes
5.6.2. German Armoured Vehicle Market Analysis
5.6.2.1. Leopard 2A7 Upgrades and Enlarged Active Fleet
5.6.2.2. Puma IFV
5.6.2.3. GFF Programme for New Light Armoured Vehicles
5.6.3. German Armoured Vehicle Market Drivers & Restraints
5.7. Indian Armoured Vehicle Market Forecast 2016-2026
5.7.1. Indian Armoured Vehicle Market Contracts & Programmes
5.7.2. Indian Armoured Vehicle Market Analysis
5.7.2.1. Arjun Mk2 Tank
5.7.2.2. The T-90
5.7.3. Indian Armoured Vehicle Market Drivers & Restraints
5.8. Israeli Armoured Vehicle Market Forecast 2016-2026
5.8.1. Israeli Armoured Vehicle Market Contracts & Programmes
5.8.2. Israeli Armoured Vehicle Market Analysis
5.8.2.1. Namer H-APC
5.8.3. Israeli Armoured Vehicle Market Drivers & Restraints
5.9. Italian Armoured Vehicle Market Forecast 2016-2026
5.9.1. Italian Armoured Vehicle Market Contracts & Programmes
5.9.2. Italian Armoured Vehicle Market Analysis
5.9.3. Italian Armoured Vehicle Market Drivers & Restraints
5.10. Japanese Armoured Vehicle Market Forecast 2016-2026
5.10.1. Japanese Armoured Vehicle Market Contracts & Programmes
5.10.2. Japanese Armoured Vehicle Market Analysis
5.10.2.1. Japan Develops New Main Battle Tank
5.10.2.2. Manoeuvre Combat Vehicle (MCV)
5.10.3. Japanese Armoured Vehicle Market Drivers & Restraints
5.11. Russian Armoured Vehicle Market Forecast 2016-2026
5.11.1. Russian Armoured Vehicle Market Analysis
5.11.2. Russian Armoured Vehicle Market Drivers & Restraints
5.12. Saudi Arabian Armoured Vehicle Market Forecast 2016-2026
5.12.1. Saudi Arabian Armoured Vehicle Market Contracts & Programmes
5.12.2. Saudi Arabian Armoured Vehicle Market Analysis
5.12.3. Saudi Arabian Armoured Vehicle Market Drivers & Restraints
5.13. South Korean Armoured Vehicle Market Forecast 2016-2026
5.13.1. South Korean Armoured Vehicle Market Analysis
5.13.2. South Korean Armoured Vehicle Market Drivers & Restraints
5.14. United Kingdom Armoured Vehicle Market Forecast 2016-2026
5.14.1. United Kingdom Armoured Vehicle Market Contracts & Programmes
5.14.2. United Kingdom Armoured Vehicle Market Analysis
5.14.3. The 2015 Strategic Defence and Security Review: Implications for the UK Armoured Vehicle Market
5.14.4. The Impact of Britain leaving the European Union
5.14.5. United Kingdom Armoured Vehicle Market Drivers & Restraints
5.15. United States Armoured Vehicle Market Forecast 2016-2026
5.15.1. United States Armoured Vehicle Selected Market Contracts & Programmes
5.15.2. United States Armoured Vehicle Market Analysis
5.15.2.1. M1A2 Abrams SEPv2 Upgrade
5.15.2.2. Bradley Tracked Vehicle Upgrade
5.15.2.3. From GCV to FFV
5.12.2.4. Stryker and DVH Modification
5.15.3. Death by a Thousand Cuts: the Impact of Sequestration on U.S. Defence and Security Policy
5.15.4. United States Armoured Vehicle Market Drivers & Restraints
5.16. Rest of the World Armoured Vehicle Market Forecast 2016-2026
5.16.1. Rest of the World Armoured Vehicle Market Contracts & Programmes
5.16.2. Rest of the World Armoured Vehicle Market Analysis
5.16.3. Czech Republic
5.16.4. Estonia
5.16.5. Finland
5.16.6. The Netherlands
5.16.7. South Africa
5.16.8. Sweden
5.16.9. Rest of the World Armoured Vehicle Market Drivers & Restraints
6. SWOT Analysis of the Armoured Vehicle Market 2016-2026
7. Leading 8 Armoured Vehicle Companies
7.1. AM General
7.1.1. AM General Armoured Vehicles Selected Recent Contracts / Projects / Programmes 2012-2016
7.1.2. AM General Armoured Vehicles Products / Services
7.1.3. AM General Primary Market Competitors 2016
7.1.4. AM General Analysis and Future Outlook
7.2. BAE Systems plc
7.2.1. BAE Systems plc Armoured Vehicle Selected Recent Contracts / Projects / Programmes 2012-2016
7.2.2. BAE Systems plc Total Company Sales 2011-2015
7.2.3. BAE Systems plc Net Income 2011-2015
7.2.4. BAE Systems plc Cost of Research & Development 2011-2015
7.2.5. BAE Systems plc Sales by Segment of Business 2011-2015
7.2.6. BAE Systems plc Regional Emphasis and Focus
7.2.7. BAE Systems plc Organisational Structure and Subsidiaries
7.2.8. BAE Systems plc Armoured Vehicle Products / Services
7.2.9. BAE Systems plc Primary Market Competitors 2016
7.2.10. BAE Systems plc Mergers & Acquisitions (M&A) Activity
7.2.11. BAE Systems plc Analysis
7.2.12. BAE Systems plc Future Outlook
7.3. General Dynamics Corporation
7.3.1. General Dynamics Armoured Vehicles Selected Recent Contracts / Projects / Programmes 2012-2016
7.3.2. General Dynamics Total Company Sales 2011-2015
7.3.3. General Dynamics Net Income / Loss 2011-2015
7.3.4. General Dynamics Cost of Research & Development 2011-2015
7.3.5. General Dynamics Sales by Segment of Business 2011-2015
7.3.6. General Dynamics Regional Emphasis and Focus
7.3.7. General Dynamics Organisational Structure
7.3.8. General Dynamics Armoured Vehicle Products / Services
7.3.9. General Dynamics Primary Market Competitors 2016
7.3.10. General Dynamics Analysis and Future Outlook
7.4. Navistar International Corporation
7.4.1. Navistar Armoured Vehicle Selected Recent Contracts / Projects / Programmes 2012-2016
7.4.2. Navistar Total Company Sales 2011-2015
7.4.3. Navistar Net Income / Loss 2011-2015
7.4.4. Navistar Net Capital Expenditure 2011-2015
7.4.5. Navistar Sales by Segment of Business 2012-2015
7.4.6. Navistar Regional Emphasis and Focus
7.4.7. Navistar Subsidiaries
7.4.8. Navistar Armoured Vehicle Products / Services
7.4.9. Navistar Primary Market Competitors 2016
7.4.10. Navistar Analysis and Future Outlook
7.5. Oshkosh Corporation
7.5.1. Oshkosh Corporation Armoured Vehicle Selected Recent Contracts / Projects / Programmes 2012-2016
7.5.2. Oshkosh Corporation Total Company Sales 2011-2015
7.5.3. Oshkosh Corporation Net Income 2011-2015
7.5.4. Oshkosh Corporation Sales by Segment of Business 2013-2015
7.5.5. Oshkosh Corporation Regional Emphasis and Focus
7.5.6. Oshkosh Corporation Armoured Vehicle Products / Services
7.5.7. Oshkosh Corporation Primary Market Competitors 2016
7.5.8. Oshkosh Corporation Analysis and Future Outlook
7.6. Rheinmetall AG
7.6.1. Rheinmetall AG Armoured Vehicle Selected Recent Contracts / Projects / Programmes 2013
7.6.2. Rheinmetall AG Total Company Sales 2011-2015
7.6.3. Rheinmetall AG Net Income / Loss 2011-2015
7.6.4. Rheinmetall AG Cost of Research & Development 2011-2015
7.6.5. Rheinmetall AG Sales by Segment of Business 2011-2015
7.6.6. Rheinmetall AG Regional Emphasis and Focus
7.6.7. Rheinmetall AG Organisational Structure and Subsidiaries
7.6.8. Rheinmetall AG Armoured Vehicle Products / Services
7.6.9. Rheinmetall AG Primary Market Competitors 2016
7.6.10. Rheinmetall AG Mergers, Acquisitions and Joint Ventures
7.6.11. Rheinmetall AG Analysis and Future Outlook
7.7. Textron Inc.
7.7.1. Textron Inc. Armoured Vehicles Selected Recent Contracts / Projects / Programmes 2012-2015
7.7.2. Textron Inc. Total Company Sales 2011-2015
7.7.3. Textron Inc. Net Income 2011-2015
7.7.4. Textron Inc. Cost of Research & Development 2011-2015
7.7.5. Textron Inc. Sales by Segment of Business 2011-2015
7.7.6. Textron Inc. Regional Emphasis and Focus
7.7.7. Textron Inc. Organisational Structure and Subsidiaries
7.7.8. Textron Inc. Primary Market Competitors 2016
7.7.9. Textron Inc. Analysis and Future Outlook
7.8. Thales Group
7.8.1. Thales Group Armoured Vehicle Selected Recent Contracts / Projects / Programmes 2013-2014
7.8.2. Thales Group Total Company Sales 2011-2015
7.8.3. Thales Group Net Income 2011-2015
7.8.4. Thales Group Cost of Research & Development 2011-2015
7.8.5. Thales Group Sales by Segment of Business 2011-2015
7.8.6. Thales Group Regional Emphasis and Focus
7.8.7. Thales Group Organisational Structure and Subsidiaries
7.8.8. Thales Group Armoured Vehicle Products / Services
7.8.9. Thales Group Primary Market Competitors 2016
7.8.10. Thales Group Analysis and Future Outlook
7.9. Other Companies Involved in the Armoured Vehicle Technologies Market 2016
8. Conclusions and Recommendations
8.1. Armoured Vehicle Market Key Findings
8.2. Armoured Vehicle Market Recommendations
9. Glossary
List of Tables
Table 1.1: Example of Leading National Armoured Vehicle Market Forecast by Submarket 2016-2026 (US$m, AGR %, Cumulative)
Table 3.1: Global Armoured Vehicle Market Forecast 2016-2026 (US$m, AGR %, CAGR %, Cumulative)
Table 4.1: Global Armoured Vehicle Technologies Submarket Forecast 2016-2026 (US$m, AGR %, Cumulative)
Table 4.2: Global Armoured Vehicle Submarket Forecast by National Market 2016-2026 (US$m, Cumulative, Global AGR %)
Table 4.3: Global Armoured Vehicle Submarket CAGR Forecast 2016-2021, 2021-2026, 2016-2026 (CAGR %)
Table 4.4: Global Armoured Vehicle Submarket Percentage Change in Market Share 2016-2021, 2021-2026, 2016-2026 (% Change)
Table 4.5: Global Main Battle Tank Submarket by National Market Forecast 2016-2026 (US$m, AGR %, CAGR %, Cumulative)
Table 4.6: Global Medium Armoured Vehicle Submarket by National Market Forecast 2016-2026 (US$m, AGR %, CAGR %, Cumulative)
Table 4.7: Global Light Protected Vehicle Submarket by National Market Forecast 2016-2026 (US$m, AGR %, CAGR %, Cumulative)
Table 4.8: Global Mine-Resistant Ambush-Protected Vehicle Submarket by National Market Forecast 2016-2026 (US$m, AGR %, CAGR %, Cumulative)
Table 4.9: Global Other Armoured Vehicles Submarket by National Market Forecast 2016-2026 (US$m, AGR %, CAGR %, Cumulative)
Table 5.1: Leading National Armoured Vehicle Market by Submarket Forecast 2016-2026 (US$m, Global AGR %, Cumulative)
Table 5.2: Leading National Armoured Vehicle Market CAGR Forecast 2016-2021, 2021-2026, 2016-2026 (CAGR %)
Table 5.3: Leading National Armoured Vehicle Market Percentage Change in Market Share 2016-2021, 2021-2026, 2016-2026 (% Change)
Table 5.4: Australian Armoured Vehicle Market by Submarkets Forecast 2016-2026 (US$m, AGR %, CAGR %, Cumulative)
Table 5.5: Australian Armoured Vehicle Market Selected Major Contracts & Programmes 2012-2015 (Date, Company, Value US$m, Customer, Details)
Table 5.6: Australian Armoured Vehicle Market Drivers & Restraints 2016
Table 5.7: Canadian Armoured Vehicle Market by Submarkets Forecast 2016-2026 (US$m, AGR %, CAGR %, Cumulative)
Table 5.8: Canadian Armoured Vehicle Market Selected Major Contracts & Programmes 2012 (Date, Company, Value US$m, Customer, Details)
Table 5.9: Canadian Armoured Vehicle Market Drivers & Restraints 2016
Table 5.10: Chinese Armoured Vehicle Market by Submarkets Forecast 2016-2026 (US$m, AGR %, CAGR %, Cumulative)
Table 5.11: Chinese Armoured Vehicle Market Drivers & Restraints 2016
Table 5.12: French Armoured Vehicle Market by Submarkets Forecast 2016-2026 (US$m, AGR %, CAGR %, Cumulative)
Table 5.13: French Armoured Vehicle Market Selected Major Contracts & Programmes 2014-2016 (Date, Company, Value US$m, Customer, Details)
Table 5.14: French Armoured Vehicle Market Drivers & Restraints 2016
Table 5.15: German Armoured Vehicle Market by Submarkets Forecast 2016-2026 (US$m, AGR %, CAGR %, Cumulative)
Table 5.16: German Armoured Vehicle Market Selected Major Contracts & Programmes 2013-2014 (Date, Company, Value US$m, Customer, Details)
Table 5.17: German Armoured Vehicle Market Drivers & Restraints 2016
Table 5.18: Indian Armoured Vehicle Market by Submarkets Forecast 2016-2026 (US$m, AGR %, CAGR %, Cumulative)
Table 5.19: Indian Armoured Vehicle Market Selected Major Contracts & Programmes 2012-2016 (Date, Company, Value US$m, Customer, Details)
Table 5.20: Indian Armoured Vehicle Market Drivers & Restraints 2016
Table 5.21: Israeli Armoured Vehicle Market by Submarkets Forecast 2016-2026 (US$m, AGR %, CAGR %, Cumulative)
Table 5.22: Israeli Armoured Vehicle Market Selected Major Contracts & Programmes 2014-2015 (Date, Company, Value US$m, Customer, Details)
Table 5.23: Israeli Armoured Vehicle Market Drivers & Restraints 2016
Table 5.24: Italian Armoured Vehicle Market by Submarkets Forecast 2016-2026 (US$m, AGR %, CAGR %, Cumulative)
Table 5.25: Italian Armoured Vehicle Market Selected Major Contracts & Programmes 2015 (Date, Company, Value US$m, Customer, Details)
Table 5.26: Italian Armoured Vehicle Market Drivers & Restraints 2016
Table 5.27: Japanese Armoured Vehicle Market by Submarkets Forecast 2016-2026 (US$m, AGR %, CAGR %, Cumulative)
Table 5.28: Japanese Armoured Vehicle Market Selected Major Contracts & Programmes 2016 (Date, Company, Value US$m, Customer, Details)
Table 5.29: Japanese Armoured Vehicle Market Drivers & Restraints 2016
Table 5.30: Russian Armoured Vehicle Market by Submarkets Forecast 2016-2026 (US$m, AGR %, CAGR %, Cumulative)
Table 5.31: Russian Armoured Vehicle Market Drivers & Restraints 2016
Table 5.32: Saudi Arabian Armoured Vehicle Market by Submarkets Forecast 2016-2026 (US$m, AGR %, CAGR %, Cumulative)
Table 5.33: Saudi Arabian Armoured Vehicle Market Selected Major Contracts & Programmes 2013-2014 (Date, Company, Value US$m, Customer, Details)
Table 5.34: Saudi Arabian Armoured Vehicle Market Drivers & Restraints 2016
Table 5.35: South Korean Armoured Vehicle Market by Submarkets Forecast 2016-2026 (US$m, AGR %, CAGR %, Cumulative)
Table 5.36: South Korean Armoured Vehicle Market Drivers & Restraints 2016
Table 5.37: United Kingdom Armoured Vehicle Market by Submarkets Forecast 2016-2026 (US$m, AGR %, CAGR %, Cumulative)
Table 5.38: United Kingdom Armoured Vehicle Market Selected Major Contracts & Programmes 2012-2015 (Date, Company, Value US$m, Customer, Details)
Table 5.39: United Kingdom Armoured Vehicle Market Drivers & Restraints 2016
Table 5.40: United States Armoured Vehicle Market by Submarkets Forecast 2016-2026 (US$m, AGR %, CAGR %, Cumulative)
Table 5.41: United States Armoured Vehicle Market Selected Major Contracts & Programmes 2012-2016 (Date, Company, Value US$m, Customer, Details)
Table 5.42: United States Armoured Vehicle Market Drivers & Restraints 2016
Table 5.43: Rest of the World Armoured Vehicle Market by Submarkets Forecast 2016-2026 (US$m, AGR %, CAGR %, Cumulative)
Table 5.44: Rest of the World Armoured Vehicle Market Selected Major Contracts & Programmes 2012-2016 (Date, Company, Value US$m, Customer, Country/Region, Details)
Table 5.45: Rest of the World Armoured Vehicle Market Drivers & Restraints 2016
Table 6.1: Global Armoured Vehicle Market SWOT Analysis 2016-2026
Table 7.1: AM General Profile 2016 (CEO, HQ, Founded, No. of Employees, Website)
Table 7.2: Selected Recent AM General Armoured Vehicles Contracts / Projects / Programmes 2012-2016 (Date, Country / Region, Customer, Value US$m, Product, Details)
Table 7.3: AM General Armoured Vehicles Products / Services (Product, Specification / Features)
Table 7.4: BAE Systems plc Profile 2016 (CEO, Total Company Sales US$m, Net Income US$m, Cost of Research & Development US$m, Business Segment in the Market, Strongest Business Region, HQ, Founded, No. of Employees, IR Contact, Ticker, Website)
Table 7.5: Selected Recent BAE Systems plc Armoured Vehicle Contracts / Projects / Programmes 2012-2016 (Date, Country, Customer, Value (US$m), Product, Details)
Table 7.6: BAE Systems plc Total Company Sales 2011-2015 (US$m, AGR %)
Table 7.7: BAE Systems plc Net Income 2011-2015 (US$m)
Table 7.8: BAE Systems plc Cost of Research & Development 2011-2015 (US$m, AGR %)
Table 7.9: BAE Systems plc Sales by Segment of Business 2011-2015 (US$m, AGR %)
Table 7.10: BAE Systems plc Sales by Geographical Location 2011-2015 (US$m, AGR %)
Table 7.11: BAE Systems plc Selected Subsidiaries 2016 (Subsidiary, Location)
Table 7.12: BAE Systems plc Armoured Vehicle Products / Services (Segment of Business, Product, Specification / Features)
Table 7.13: Selected BAE Systems plc Divestitures 2012-2013 (Date, Company Involved, Value US$m, Details)
Table 7.14: General Dynamics Profile 2016 (CEO, Total Company Sales US$m, Net Income US$m, Cost of Research & Development US$m, Business Segment in the Market, Strongest Business Region, Strongest Business Segment, HQ, Founded, No. of Employees, IR Contact, Ticker, Website)
Table 7.15: Selected Recent General Dynamics Armoured Vehicle Contracts / Projects / Programmes 2012-2016 (Date, Country / Region, Customer, Value US$m, Product, Details)
Table 7.16: General Dynamics Total Company Sales 2011-2015 (US$m, AGR %)
Table 7.17: General Dynamics Net Income / Loss 2011-2015 (US$m)
Table 7.18: General Dynamics Cost of Research & Development 2011-2015 (US$m, AGR %)
Table 7.19: General Dynamics Sales by Segment of Business 2011-2015 (US$m, AGR %)
Table 7.20: General Dynamics Sales by Geographical Location 2012-2015 (US$m, AGR %)
Table 7.21: General Dynamics Armoured Vehicle Products / Services (Segment of Business, Product, Specification / Features)
Table 7.22: Navistar Profile 2016 (CEO, Total Company Sales US$m, Net Income US$m, Net Capital Expenditure US$m, Business Segment in the Market, Strongest Business Region, Strongest Business Segment, HQ, Founded, No. of Employees, Ticker, Website)
Table 7.23: Selected Recent Navistar Armoured Vehicle Contracts / Projects / Programmes 2012-2016 (Date, Country / Region, Customer, Value US$m, Product, Details)
Table 7.24: Navistar Total Company Sales 2011-2015 (US$m, AGR %)
Table 7.25: Navistar Net Income / Loss 2011-2015 (US$m)
Table 7.26: Navistar Net Capital Expenditure 2011-2015 (US$m, AGR %)
Table 7.27: Navistar Sales by Segment of Business 2012-2015 (US$m, AGR %)
Table 7.28: Navistar Sales by Geographical Location 2011-2015 (US$m, AGR %)
Table 7.29: Navistar Subsidiaries 2016 (Subsidiary, Location)
Table 7.30: Navistar Armoured Vehicle Products / Services (Product, Specification / Features)
Table 7.31: Oshkosh Corporation Profile 2016 (CEO, Total Company Sales US$m, Net Income US$m, Business Segment in the Market, Strongest Business Region, Strongest Business Segment, HQ, Founded, IR Contact, Ticker, Website)
Table 7.32: Selected Recent Oshkosh Corporation Armoured Vehicle Contracts / Projects / Programmes 2012-2016 (Date, Country / Region, Customer, Value US$m, Product, Details)
Table 7.33: Oshkosh Corporation Total Company Sales 2011-2015 (US$m, AGR %)
Table 7.34: Oshkosh Corporation Net Income 2011-2015 (US$m, AGR %)
Table 7.35: Oshkosh Corporation Sales by Segment of Business 2013-2015 (US$m, AGR %)
Table 7.36: Oshkosh Corporation Sales by Geographical Location 2013-2015 (US$m, AGR %)
Table 7.37: Oshkosh Corporation Armoured Vehicle Products / Services (Segment of Business, Product, Specification / Features)
Table 7.38: Rheinmetall AG Profile 2016 (CEO, Total Company Sales US$m, Net Income US$m, Cost of Research & Development US$m, Business Segment in the Market, Strongest Business Region, Strongest Business Segment, HQ, Founded, No. of Employees, IR Contact, Ticker, Website)
Table 7.39: Selected Recent Rheinmetall AG Armoured Vehicle Contracts / Projects / Programmes 2013 (Date, Country / Region, Customer, Value US$m, Product, Details)
Table 7.40: Rheinmetall AG Total Company Sales 2011-2015 (US$m, AGR %)
Table 7.41: Rheinmetall AG Net Income / Loss 2011-2015 (US$m)
Table 7.42: Rheinmetall AG Cost of Research & Development 2011-2015 (US$m, AGR %)
Table 7.43: Rheinmetall AG Sales by Segment of Business 2011-2015 (US$m, AGR %)
Table 7.44: Rheinmetall AG Sales by Geographical Location 2011-2015 (US$m, AGR %)
Table 7.45: Rheinmetall AG Subsidiaries 2016 (Subsidiary, Location)
Table 7.46: Rheinmetall AG Armoured Vehicle Products / Services (Segment of Business, Product, Specification / Features)
Table 7.47: Selected Rheinmetall AG Mergers, Acquisitions and Joint Ventures 2008-2014 (Date, Company Involved, Details)
Table 7.48: Textron Inc. Profile 2016 (CEO, Total Company Sales US$m, Net Income US$m, Cost of Research & Development US$m, Business Segment in the Market, Strongest Business Region, Strongest Business Segment, HQ, Founded, No. of Employees, IR Contact, Ticker, Website)
Table 7.49: Selected Recent Textron Inc. Armoured Vehicle Contracts / Projects / Programmes 2012-2015 (Date, Country / Region, Customer, Value US$m, Product, Details)
Table 7.50: Textron Inc. Total Company Sales 2011-2015 (US$m, AGR %)
Table 7.51: Textron Inc. Net Income 2011-2015 (US$m, AGR %)
Table 7.52: Textron Inc. Cost of Research & Development 2011-2015 (US$m, AGR %)
Table 7.53: Textron Inc. Sales by Segment of Business 2011-2015 (US$m, AGR %)
Table 7.54: Textron Inc. Sales by Geographical Location 2011-2015 (US$m, AGR %)
Table 7.55: Textron Inc. Subsidiaries 2016 (Subsidiary, Location)
Table 7.56: Thales Group Profile 2016 (CEO, Total Company Sales US$m, Net Income US$m, Cost of Research & Development US$m, Business Segment in the Market, Strongest Business Region, HQ, Founded, No. of Employees, IR Contact, Ticker, Website)
Table 7.57: Selected Recent Thales Group Armoured Vehicle Contracts / Projects / Programmes 2013-2014 (Date, Country, Customer, Value US$m, Product, Details)
Table 7.58: Thales Group Total Company Sales 2011-2015 (US$m, AGR %)
Table 7.59: Thales Group Net Income 2011-2015 (US$m, AGR %)
Table 7.60: Thales Group Cost of Research & Development 2011-2015 (US$m, AGR %)
Table 7.61: Thales Group Sales by Segment of Business 2011-2015 (US$m, AGR %)
Table 7.62: Thales Group Sales by Geographical Location 2011-2015 (US$m, AGR %)
Table 7.63: Thales Group Subsidiaries 2016 (Subsidiary, Location)
Table 7.64: Thales Group Armoured Vehicle Products / Services (Segment of Business, Product, Specification / Features)
Table 7.65: Other Companies Involved in the Armoured Vehicle Market 2016 (Company, Location)
List of Figures
Figure 1.1: Example of National vs. Global Armoured Vehicle Market CAGR Forecast 2016-2026, 2016-2021, 2021-2026 (CAGR %)
Figure 1.2: Example of National Armoured Vehicle Market by Submarket Forecast 2016-2026 (US$m, AGR %)
Figure 2.1: Global Armoured Vehicle Market Segmentation Overview
Figure 3.1: Global Armoured Vehicle Market Forecast 2016-2026 (US$m, AGR %)
Figure 4.1: Global Armoured Vehicle Submarket AGR Forecast 2016-2026 (AGR %)
Figure 4.2: Global Armoured Vehicle Submarket Forecast 2016-2026 (US$m, Global AGR %)
Figure 4.3: Global Armoured Vehicle Submarket Share Forecast 2016 (% Share)
Figure 4.4: Global Armoured Vehicle Submarket Share Forecast 2021 (% Share)
Figure 4.5: Global Armoured Vehicle Submarket Share Forecast 2026 (% Share)
Figure 4.6: Global Main Battle Tank Submarket Forecast by National Market 2016-2026 (US$m, Global AGR %)
Figure 4.7: Global Main Battle Tank Submarket Share by National Market Forecast 2016 (% Share)
Figure 4.8: Global Main Battle Tank Submarket Share by National Market Forecast 2021 (% Share)
Figure 4.9: Global Main Battle Tank Submarket Share by National Market Forecast 2026 (% Share)
Figure 4.10: Global Medium Armoured Vehicle Submarket Forecast by National Market 2016-2026 (US$m, Global AGR %)
Figure 4.11: Global Medium Armoured Vehicle Submarket Share by National Market Forecast 2016 (% Share)
Figure 4.12: Global Medium Armoured Vehicle Submarket Share by National Market Forecast 2021 (% Share)
Figure 4.13: Global Medium Armoured Vehicle Submarket Share by National Market Forecast 2026 (% Share)
Figure 4.14: Global Light Protected Vehicle Submarket Forecast by National Market 2016-2026 (US$m, Global AGR %)
Figure 4.15: Global Light Protected Vehicles Submarket Share by National Market Forecast 2016 (% Share)
Figure 4.16: Global Light Protected Vehicle Submarket Share by National Market Forecast 2021 (% Share)
Figure 4.17: Global Light Protected Vehicle Submarket Share by National Market Forecast 2026 (% Share)
Figure 4.18: Global Mine-Resistant Ambush-Protected Vehicle Submarket Forecast by National Market 2016-2026 (US$m, Global AGR %)
Figure 4.19: Global Mine-Resistant Ambush-Protected Vehicle Submarket Share by National Market Forecast 2016 (% Share)
Figure 4.20: Global Mine-Resistant Ambush-Protected Vehicle Submarket Share by National Market Forecast 2021 (% Share)
Figure 4.21: Global Mine-Resistant Ambush-Protected Vehicle Submarket Share by National Market Forecast 2026 (% Share)
Figure 4.22: Global Other Armoured Vehicles Submarket Forecast by National Market 2016-2026 (US$m, Global AGR %)
Figure 4.23: Global Other Armoured Vehicles Submarket Share by National Market Forecast 2016 (% Share)
Figure 4.24: Global Other Armoured Vehicles Submarket Share by National Market Forecast 2021 (% Share)
Figure 4.25: Global Other Armoured Vehicles Submarket Share by National Market Forecast 2026 (% Share)
Figure 4.26: Global Armoured Vehicle Submarket Cumulative Market Share Forecast 2016-2021 (% Share)
Figure 4.27: Global Armoured Vehicle Submarket Cumulative Market Share Forecast 2021-2026 (% Share)
Figure 4.28: Global Armoured Vehicle Technologies Submarket Cumulative Market Share Forecast 2016-2026 (% Share)
Figure 5.1: Leading National Armoured Vehicle Market Forecast 2016-2026 (AGR %)
Figure 5.2: Leading National Armoured Vehicle Market by National Market Forecast 2016-2026 (US$m, Global AGR %)
Figure 5.3: Leading National Armoured Vehicle Market Share Forecast 2016 (% Share)
Figure 5.4: Leading National Armoured Vehicle Market Share Forecast 2021 (% Share)
Figure 5.5: Leading National Armoured Vehicle Market Share Forecast 2026 (% Share)
Figure 5.6: Australian Armoured Vehicle Submarkets AGR Forecast 2016-2026 (AGR %)
Figure 5.7: Australian Armoured Vehicle Market by Submarkets Forecast 2016-2026 (US$m, Australian Total Market Sales AGR %)
Figure 5.8: Canadian Armoured Vehicle Submarkets AGR Forecast 2016-2026 (AGR %)
Figure 5.9: Canadian Armoured Vehicle Market by Submarkets Forecast 2016-2026 (US$m, Canadian Total Market Sales AGR %)
Figure 5.10: Chinese Armoured Vehicle Submarkets AGR Forecast 2016-2026 (AGR %)
Figure 5.11: Chinese Armoured Vehicle Market by Submarkets Forecast 2016-2026 (US$m, Chinese Total Market Sales AGR %)
Figure 5.12: French Armoured Vehicle Submarkets AGR Forecast 2016-2026 (AGR %)
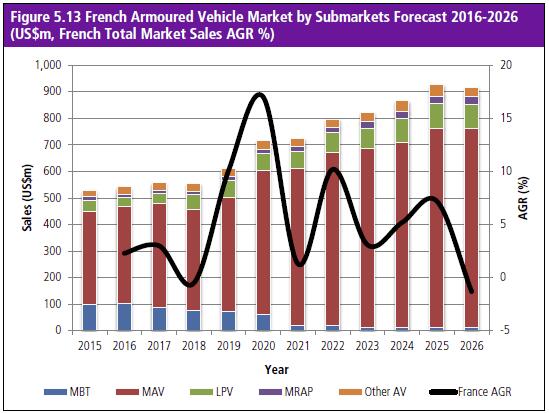
Figure 5.13: French Armoured Vehicle Market by Submarkets Forecast 2016-2026 (US$m, French Total Market Sales AGR %)
Figure 5.14: German Armoured Vehicle Submarkets AGR Forecast 2016-2026 (AGR %)
Figure 5.15: German Armoured Vehicle Market by Submarkets Forecast 2016-2026 (US$m, German Total Market Sales AGR %)
Figure 5.16: Indian Armoured Vehicle Submarkets AGR Forecast 2016-2026 (AGR %)
Figure 5.17: Indian Armoured Vehicle Market by Submarkets Forecast 2016-2026 (US$m, Indian Total Market Sales AGR %)
Figure 5.18: Israeli Armoured Vehicle Submarkets AGR Forecast 2016-2026 (AGR %)
Figure 5.19: Israeli Armoured Vehicle Market by Submarkets Forecast 2016-2026 (US$m, Israeli Total Market Sales AGR %)
Figure 5.20: Italian Armoured Vehicle Submarkets AGR Forecast 2016-2026 (AGR %)
Figure 5.21: Italian Armoured Vehicle Market by Submarkets Forecast 2016-2026 (US$m, Italian Total Market Sales AGR %)
Figure 5.22: Japanese Armoured Vehicle Submarkets AGR Forecast 2016-2026 (AGR %)
Figure 5.23: Japanese Armoured Vehicle Market by Submarkets Forecast 2016-2026 (US$m, Japanese Total Market Sales AGR %)
Figure 5.24: Russian Armoured Vehicle Submarkets AGR Forecast 2016-2026 (AGR %)
Figure 5.25: Russian Armoured Vehicle Market by Submarkets Forecast 2016-2026 (US$m, Russian Total Market Sales AGR %)
Figure 5.26: Saudi Arabian Armoured Vehicle Submarkets AGR Forecast 2016-2026 (AGR %)
Figure 5.27: Saudi Arabian Armoured Vehicle Market by Submarkets Forecast 2016-2026 (US$m, Saudi Arabian Total Market Sales AGR %)
Figure 5.28: South Korean Armoured Vehicle Submarkets AGR Forecast 2016-2026 (AGR %)
Figure 5.29: South Korean Armoured Vehicle Market by Submarkets Forecast 2016-2026 (US$m, South Korean Total Market Sales AGR %)
Figure 5.30: United Kingdom Armoured Vehicle Submarkets AGR Forecast 2016-2026 (AGR %)
Figure 5.31: United Kingdom Armoured Vehicle Market by Submarkets Forecast 2016-2026 (US$m, United Kingdom Total Market Sales AGR %)
Figure 5.32: United States Armoured Vehicle Submarkets AGR Forecast 2016-2026 (AGR %)
Figure 5.33: United States Armoured Vehicle Market by Submarkets Forecast 2016-2026 (US$m, United States Total Market Sales AGR %)
Figure 5.34: Rest of the World Armoured Vehicle Submarkets AGR Forecast 2016-2026 (AGR %)
Figure 5.35: Rest of the World Armoured Vehicle Market by Submarkets Forecast 2016-2026 (US$m, Rest of the World Total Market Sales AGR %)
Figure 7.1: AM General Primary Market Competitors 2016
Figure 7.2: BAE Systems plc Total Company Sales 2011-2015 (US$m, AGR %)
Figure 7.3: BAE Systems plc Net Income 2011-2015 (US$m)
Figure 7.4: BAE Systems plc Cost of Research & Development 2011-2015 (US$m, AGR %)
Figure 7.5: BAE Systems plc Sales by Segment of Business 2011-2015 (US$m, Total Company Sales AGR %)
Figure 7.6: BAE Systems plc Primary International Operations 2016
Figure 7.7: BAE Systems plc Sales by Geographical Location 2011-2015 (US$m, Total Company Sales AGR %)
Figure 7.8: BAE Systems plc Organisational Structure 2016
Figure 7.9: BAE Systems plc Primary Market Competitors 2016
Figure 7.10: General Dynamics Total Company Sales 2011-2015 (US$m, AGR %)
Figure 7.11: General Dynamics Net Income / Loss 2011-2015 (US$m)
Figure 7.12: General Dynamics Cost of Research & Development 2011-2015 (US$m, AGR %)
Figure 7.13: General Dynamics Sales by Segment of Business 2011-2015 (US$m, Total Company Sales AGR %)
Figure 7.14: General Dynamics Primary International Operations 2016
Figure 7.15: General Dynamics Sales by Geographical Location 2012-2015 (US$m, Total Company Sales AGR %)
Figure 7.16: General Dynamics Organisational Structure 2016
Figure 7.17: General Dynamics Primary Market Competitors 2016
Figure 7.18: Navistar Total Company Sales 2011-2015 (US$m, AGR %)
Figure 7.19: Navistar Net Income / Loss 2011-2015 (US$m)
Figure 7.20: Navistar Net Capital Expenditure 2011-2015 (US$m, AGR %)
Figure 7.21: Navistar Sales by Segment of Business 2012-2015 (US$m, Total Company Sales AGR %)
Figure 7.22: Navistar Primary International Operations 2016
Figure 7.23: Navistar Sales by Geographical Location 2011-2015 (US$m, Total Company Sales AGR %)
Figure 7.24: Navistar Primary Market Competitors 2016
Figure 7.25: Oshkosh Corporation Total Company Sales 2011-2015 (US$m, AGR %)
Figure 7.26: Oshkosh Corporation Net Income 2011-2015 (US$m, AGR %)
Figure 7.27: Oshkosh Corporation Sales by Segment of Business 2013-2015 (US$m)
Figure 7.28: Oshkosh Corporation Primary International Operations 2016
Figure 7.29: Oshkosh Corporation Sales by Geographical Location 2013-2015 (US$m)
Figure 7.30: Oshkosh Corporation Primary Market Competitors 2016
Figure 7.31: Rheinmetall AG Total Company Sales 2011-2015 (US$m, AGR %)
Figure 7.32: Rheinmetall AG Net Income / Loss 2011-2015 (US$m)
Figure 7.33: Rheinmetall AG Cost of Research & Development 2011-2015 (US$m, AGR %)
Figure 7.34: Rheinmetall AG Sales by Segment of Business 2011-2015 (US$m, Total Company Sales AGR %)
Figure 7.35: Rheinmetall AG Primary International Operations 2016
Figure 7.36: Rheinmetall AG Sales by Geographical Location 2011-2015 (US$m, Total Company Sales AGR %)
Figure 7.37: Rheinmetall AG Organisational Structure 2016
Figure 7.38: Rheinmetall AG Primary Market Competitors 2016
Figure 7.39: Textron Inc. Total Company Sales 2011-2015 (US$m, AGR %)
Figure 7.40: Textron Inc. Net Income 2011-2015 (US$m, AGR %)
Figure 7.41: Textron Inc. Cost of Research & Development 2011-2015 (US$m, AGR %)
Figure 7.42: Textron Inc. Sales by Segment of Business 2011-2015 (US$m, Total Company Sales AGR %)
Figure 7.43: Textron Inc. Primary International Operations 2016
Figure 7.44: Textron Inc. Sales by Geographical Location 2011-2015 (US$m, Total Company Sales AGR %)
Figure 7.45: Textron Inc. Organisational Structure 2016
Figure 7.46: Textron Inc. Primary Market Competitors 2016
Figure 7.47: Thales Group Total Company Sales 2011-2015 (US$m, AGR %)
Figure 7.48: Thales Group Net Income 2011-2015 (US$m, AGR %)
Figure 7.49: Thales Group Cost of Research & Development 2011-2015 (US$m, AGR %)
Figure 7.50: Thales Group Sales by Segment of Business 2011-2015 (US$m, Total Company Sales AGR %)
Figure 7.51: Thales Group Primary International Operations 2016
Figure 7.52: Thales Group Sales by Geographical Location 2011-2015 (US$m, Total Company Sales AGR %)
Figure 7.53: Thales Group Organisational Structure 2016
Figure 7.54: Thales Group Primary Market Competitors 2016
Companies Listed
ADS - Gesellschaft für aktive Schutzsysteme GmbH
AIM Infrarot-Module GmbH
Air Command Systems International SAS
Airtanker Holdings Ltd
Allison Transmission
AM General LLC
American Rheinmetall Munitions, Inc.
Amper Programas de Electronica Y Comunicaciones SA
Artec consortium
Aselsan
Avco Corporation
Aviation Communications & Surveillance Systems
AxleTech International LLC
BAE Systems (Operations) Limited
BAE Systems AB
BAE Systems Australia
BAE Systems Controls Inc.
BAE Systems Flight Training (Australia) Pty Limited
BAE Systems Hägglunds
BAE Systems Information and Electronic Systems Integration Inc.
BAE Systems Information Solutions Inc
BAE Systems Land & Armaments LP
BAE Systems Oman
BAE Systems plc
BAE Systems Regional Aircraft (Japan) KK
BAE Systems Saudi Arabia
BAE Systems Surface Ships Limited
BAE Systems Tactical Vehicle Systems LP
BAE Systems Zephyr Corporation
BAeHAL
Bell Helicopter Textron Inc.
benntec Systemtechnik GmbH
Bharat
Blue Diamond Parts LLC
Boeing Company
Brighton Cromwell LLC
Cadillac Gage Textron Inc.
Caterpillar Inc.
Cessna Aircraft Company
Cessna Finance Export Corporation
Citylink Telecommunications Holding Ltd
Cloudwatt
CMI Defence
Commercial Armored Vehicles LLC
Continental AG
Contraves Advanced Devices Sdn. Bhd.,
Critical Solutions International
Cummins
Daewoo Heavy Industries and Machinery Ltd.
Daimler AG
DCNS
Denel Munitions
Detica Services, Inc
Dew Engineering & Development
Diehl Aerospace GmbH
Diehl BGT Defence
Diesel Engineering, Inc
Doosan Infracore
DRS Technologies Inc.
DynCorp International
Elbit Systems
Elettronica SpA
ESG Elektroniksystem- und Logistik GmbH
Finmeccanica/Leonardo
FNSS Savuma Sistemleri AS
General Dynamics European Land Systems
General Dynamics Land Systems
General Dynamics UK
GIWS Gesellschaft für Intelligente Wirksysteme GmbH
Greenlee Textron Inc.
Heavy Vehicles Factory Avadi
Honeywell
Hyundai
Hyundai Rotem
IBIS TEK
IC Bus, LLC
IGOV Technologies Inc.
Industrial Laser Electronics and Engineering (I.L.E.E.),
International Industria Automotiva da America do Sul Ltda.
International of Mexico Holding Corporation
International Truck and Engine Corporation Cayman Islands Holding Company
Israel Military Industries (IMI)
Iveco
Japan Steel Works
Junghans Microtec GmbH
Kautex Inc.
KBR
Kharkiv Morozov Machine Design Bureau
Kongsberg
Krauss-Maffei Wegmann (KMW)
Kurganmashzavod JSC
Land Services Arabia Ltd.
LDT Laser Display Technology GmbH
Lockheed Martin
Lycoming Engines
MBDA
Mitsubishi Heavy Industries
Navistar Canada, Inc.
Navistar Financial Corporation
Navistar International Corporation
Navistar Mexico, S. de R.L. de C.V.
Navistar, Inc.
Nexter
Nitrochemie AG
NORINCO
Northrop Grumman Corporation
O'Gara Group, Inc.
Orbital ATK
Otokar
Panhard
Paramount Group
Patria
Pitch Technologies AB
Plasan
Polaris Defense Inc.
Poly Group
QinetiQ Ltd
Rafael Advanced Defense Systems Ltd.
Raytheon
Renault Trucks Defence
Renk AG
Rheinmetall AG
Rheinmetall Air Defence AG,
Rheinmetall Ballistic Protection GmbH
Rheinmetall Canada Inc
Rheinmetall Chempro GmbH
Rheinmetall Defence Electronics GmbH
Rheinmetall Defence UK Limited
Rheinmetall Denel Munition (Pty) Ltd
Rheinmetall Dienstleistungszentrum Altmark GmbH
Rheinmetall Eastern Markets GmbH,
Rheinmetall Hellas S.A.
Rheinmetall Italia S.p.A.,
Rheinmetall Landsysteme GmbH
Rheinmetall MAN Military Vehicles GmbH
Rheinmetall MAN Military Vehicles Nederland B.V.
Rheinmetall Nordic AS
Rheinmetall Protection Systems Nederland B.V.,
Rheinmetall Simulation Australia Pty Ltd
Rheinmetall Soldier Electronics GmbH
Rheinmetall Technical Publications GmbH,
Rheinmetall Waffe Munition Arges GmbH
Rheinmetall Waffe Munition GmbH
Ricardo Plc
Roketsan
Rolls-Royce
RPL (Electronics) Limited
Ruag
RWM Italia S.p.A
RWM Schweiz AG
RWM Zaugg AG
Saab
Safariland, LLC
Sagem
SAIC
Samsung Techwin
Samsung Thales Co. Ltd
Singapore Technologies
Sofradir SAS
Steyr-Daimler-Puch Spezialfahrzeug GmbH
Tata Motors
TDA Armements SAS
Telespazio SpA
Textron Atlantic LLC
Textron Aviation Finance Corporation
Textron China Inc.
Textron Communications Inc.
Textron Far East Pte. Ltd.
Textron Fastening Systems Inc.
Textron Financial Corporation
Textron Fluid and Power Inc.
Textron Global Services Inc.
Textron International Inc.
Textron IPMP Inc.
Textron Management Services Inc.
Textron Realty Corporation
Textron Rhode Island Inc.
Textron Systems Canada Inc.
Thales Air Defence Ltd
Thales Air Systems & Electron Devices GmbH
Thales Air Systems SAS
Thales Alenia Space Italia SpA
Thales Alenia Space SAS
Thales Australia Ltd
Thales Austria GmbH
Thales Avionics Electrical Systems SAS
Thales Avionics Inc.
Thales Avionics Ltd
Thales Avionics SAS
Thales Canada Inc.
Thales Communications & Security SAS
Thales Components Corporation
Thales Defense & Security, Inc. (ex Communications Inc.)
Thales Electron Devices SAS
Thales Electronic Systems GmbH
Thales Espana Grp, S.A.U.
Thales Group
Thales International Saudi Arabia
Thales Italia SpA
Thales Naval Ltd
Thales Nederland B.V.
Thales Norway A.Š.
Thales Optronics Ltd
Thales Optronique SA
Thales Rail Signalling Solutions Ltd
Thales Security Solutions & Services Company
Thales Services SAS
Thales Solutions Asia Pte Ltd
Thales Systèmes Aéroportés SAS
Thales Training & Simulation Ltd
Thales Training & Simulation SA
Thales Transport & Security Ltd
Thales Transportation Systems GmbH
Thales UK Ltd
Thales Underwater Systems SAS
Thales Underwater Systems SAS Ltd
Thales-Raytheon Systems Company LLC
Thales-Raytheon Systems Company SAS
TRAK International, Inc.
Trixell SAS
Turbine Engine Components Textron (Newington Operations) Inc.
Universal Engineering
Uralvagonzavod
Uralvagonzavod JSC
Vinghφg AS
Vingtech Corp.
Volkswagen AG
Volvo Group AB
Westminster Insurance Company
Other Organisations Mentioned in this Report
Afghan National Army
Armed Forces of Senegal
Army of France
Army of Germany
Army of Venezuela
Australian Army
Australian Defence Forces
Australian Defence Material Organisation (DMO)
Brazilian Army
Bulgarian National Military Forces
Bundeswehr
Canada's Department of National Defence
Chinese Airborne Forces
Czech Republic Army
Defence Research and Development Organisation (DRDO)
Defence Support Group
Defense Logistics Agency
Djibouti Armed Forces
European Union (EU)
Finnish Army
French Defence Procurement Agency
French Special Forces
German MoD
Government of Australia
Government of Brazil
Government of Bulgaria
Government of Canada
Government of Colombia
Government of Gabon
Government of Germany
Government of Iraq
Government of Israel
Government of Jamaica
Government of Japan
Government of Pakistan
Government of Peru
Government of Russia
Government of Saudi Arabia
Government of South Korea
Government of Sweden
Government of Switzerland
Government of the Netherlands
Government of the United Kingdom
Guantanamo Bay
Hamas
Human Rights Watch
Indian Army
Industry Trade Association
International Energy Agency (IEA)
International Security Assistance Force
Iraqi Ground Forces
Israel Defence Forces (IDF)
Italian Armed Forces
Japan's Ministry of Defense
Japanese Ground Self-Defence Force
Knesset
Knesset Defence Committee
Lebanese Armed Forces
Mexican Army
Ministère de la Défense
Ministero della Difesa
North Atlantic Treaty Organisation (NATO)
Organization of Petroleum Exporting Countries (OPEC)
People's Liberation Army (PLA)
Peruvian Army
Royal Australian Air Force
Royal Australian Army
Royal Moroccan Armed Forces
Royal Thai Army (RTA)
Scottish National Party (SNP)
South African National Defence ForceBrazil Marine Corps
South Korea's Ministry of National Defense
Stockholm International Peace Research Institute (SIPRI)
Sweden's Defence Materiel Organisation
The Coalition Government
Transparency International
Turkish Land Forces
U.S Special Operations Command
U.S. Air Force
U.S. Army
U.S. Army National Guard
U.S. Army Reserve
U.S. Army's Armored Brigade Combat Team (ABCT)
U.S. Department of Defense (DoD)
U.S. Marine Corps
U.S. Navy
U.S. Securities and Exchange Commission
United Nations (UN)
http://www.bimarket.cn/Report/ReportInfo.aspx?Id=26050