http://www.bimarket.cn/Report/ReportInfo.aspx?Id=25875
DESCRIPTION
The latest report from business intelligence provider visiongain offers comprehensive analysis of the global EV supply equipment (EVSE) market. Visiongain assesses that the number of deployed EVSE will be over 2.2 million in 2016. EVSE is undeniably one of the fastest growing segments in the automotive sector.
The report answer the following questions:
How is the EVSE market evolving and what is driving and restraining market dynamics?
How will each one of the EVSE submarket segments grow and which technologies will prevail?
How will the national markets change by 2026 and which country will lead the EVSE market?
Who are the leading players and what are their prospects over the forecast period?
And what are the trends in the EVSE and Electric Vehicles market?
We break down the most important sub segment of the automotive industry but also the key charging type's, infrastructure providers', and countries' market shares, deployment numbers and characteristics that will make them lead this specific market.
Now: “Tesla Looks to Sheetz for Expansion of EV Charging Stations”. This is an example of the business critical headline that you need to know about and more importantly, you need to read visiongain's objective analysis of how this will impact your company and the industry more broadly. How are you and your company reacting to this news? Are you sufficiently informed?
Report Scope
233 tables, charts and graphs analysing the EVSE market
Overview of the global EVSE market status from 2016-2026
Forecasts & analysis of the technologies and applications for EVSE
Private EVSE
Slow Public EVSE
Fast Public EVSE
Overview of the role of standards and compatibility
Analysis of the EVSE stock deployment for private and commercial use from 2016 to 2026
Regional forecast of the global EVSE market (in million units deployed) and its 3 submarkets:
Forecast of each submarket by country throughout 2016-2026 and their respective market shares both globally and within the country.
US
Canada
France
Germany
Italy
Netherlands
Norway
Sweden
UK
Russia
China
India
Japan
South Korea
South Africa
PESTEL analysis fused with major opportunities and threats of the EV charging infrastructure market.
Expert opinion from a key-opinion leader in the market:, ClipperCreek
Profiles of 15 leading companies in the market as well as their EVSE product portfolio.
Liberty Plugins
Chargemaster
ClipperCreek
NRG EVgo
ChargePoint
FullCharger
Elektromotive
Bosch
Circontrol
Tesla Motors
Siemens
General Electric
Schneider Electric
AeroVironment
Leviton
Conclusions, trends and implications
How this report will benefit you
Read on to discover how you can exploit the future business opportunities emerging in the EVSE sector. Visiongain's new study tells you and tells you NOW.
In this brand new report you find 233 in-depth tables, charts and graphs, and trends - all unavailable elsewhere.
The 192 page report provides clear detailed insight into the global EVSE market. Discover the key drivers and challenges affecting the market.
By ordering and reading our brand new report today you stay better informed and ready to act.
How will you benefit from this report?
Keep your knowledge base up to speed. Don't get left behind
Reinforce your strategic decision-making with definitive and reliable market data
Learn how to exploit new technological trends
Realise your company's full potential within the market
Understand the competitive landscape and identify potential new business opportunities & partnerships
Who should read this report?
Anyone within the automotive value chain.
Automotive OEMs
Electric vehicle manufacturers
Charging station manufacturers
Local authorities
CEO's
COO's
CIO's
Business development managers
Marketing managers
Technologists
Suppliers
Investors
Banks
Government agencies
Contractors
Visiongain's study is intended for anyone requiring commercial analyses for the EVSE market and leading companies. You find data, trends and predictions.
Buy our report today Electric Vehicle Supply Equipment (EVSE) Market Forecast 2016-2026: Electric Vehicle Charging Stations (EVCS), Private & Public, Slow & Fast Chargers: Top Companies Providing e-Mobility Networks, Vehicle To Grid (V2G) & Home (V2H) Infrastructure, Points & Outlets, Solar Power Automotive Recharging Stations (SPARC) for Battery Electric Vehicles (BEV) & Plug-in Hybrid Electric Vehicle (PHEV): Technologies (Inductive, Wireless & AC Level 1 & 2, DC Fast-Charging, Charging Lanes, Online Electric Vehicle (OLEV), CHAdeMO, Tesla Supercharger). Avoid missing out by staying informed - get our report now.
visiongain is a trading partner with the US Federal Government.
TABLE OF CONTENTS
1. Report Overview
1.1. Electric Vehicle Charging Station Definition and Levels of Charging
1.2. Why You Should Read This Report
1.3. How This Report Delivers
1.4. Key Questions Answered by This Analytical Report Include:
1.5. Who is This Report For?
1.6. Methodology
1.7. Frequently Asked Questions (FAQ)
1.8. Associated Visiongain Reports
1.9. About Visiongain
2. Introduction to Electric Vehicle Charging Stations
2.1. International Status of EV Charging Infrastructure 2010-2015
2.2. Safety in Charging Stations
2.3. Standards for EV Charging
2.3.1. Standards for Charging Modes
2.3.2. Car Model and Plug Types Compatibility
2.4. Charging Time
2.5. Installation of Public Charging Stations
2.6. Renewable Energy Charging Station
2.6.1. Solar Power Automotive Recharging Station (SPARC)
2.6.2. Wind Charging Station
2.6.3. E-Transportation Centre (Prototype)
2.7. Inductive Charging
2.7.1. Charging Lanes
2.7.1.1. Online Electric Vehicle (OLEV)
2.8. Vehicle-to-Grid (V2G) Communication
2.9. EV Charging Infrastructure Regulatory Incentive
2.10. EVSE Installation Targets
2.11. Market Definition of the EV Charging Infrastructure Market
2.12. Segmentation of the EV Charging Infrastructure Market
2.12.1. Private EVSEs
2.12.2. Public EVSEs
3. Global EV Charging Infrastructure Market
3.1. Global EV Charging Infrastructure Market Overview
3.2. Global EV Charging Infrastructure Market Trends
3.3. EVSE Cost Components High-Low Scenario
3.3.1. Low Cost Scenario of EVSE Deployment
3.3.2. High Cost Scenario of EVSE Deployment
3.3.3. Comparative Cost Analysis between High and Low Scenarios
3.4. Global EV Charging Infrastructure Market Forecast
3.4.1. Historical Global EVSE Stock by Charger Type 2005-2015
3.4.2. Global EVSE Stock 2016-2026 Market Forecast
3.5. Global EVSE Stock by Charger Type 2016-2026 Market Forecast
3.5.1. Global Private Chargers Submarket Forecast 2016-2026
3.5.2. Global Public Chargers Submarket Forecast 2016-2026
3.5.2.1. Global Public Slow Chargers Submarket Forecast 2016-2026
3.5.2.2. Global Public Fast Chargers Submarket Forecast 2016-2026
4. National EV Charging Infrastructure Market Forecast 2016-2026
4.1. National Total EVSE Stock Deployment Forecast 2016-2026
4.2. National Private EVSE Stock Deployment Forecast 2016-2026
4.3. National Slow Public EVSE Stock Market Forecast 2016-2026
4.4. National Fast Public EVSE Stock Market Forecast 2016-2026
4.5. EV Charging Infrastructure Market Forecast by Country 2016-2026
4.5.1. Why is the US Number 1 and Which States are Leading?
4.5.1.1. US Private EVSE Deployment Forecast 2016-2026 & Analysis
4.5.1.2. US Slow Public EVSE Deployment Forecast Outlook 2016-2026
4.5.1.3. US Fast Public EVSE Deployment Forecast 2016-2026: What are the Prospects?
4.5.1.4. US EVSE Market Share Summary 2016, 2021, 2026
4.5.1.5. Find out How US Consumer Charging Behaviour Changing?
4.5.1.6. What Will Drive EVSE Deployment in 13 States?
4.5.2. Canadian Charging Infrastructure Market: First Longest Highway Covered
4.5.2.1. Canada Private EVSE Stock Deployment Forecast Outlook 2016-2026
4.5.2.2. Canada Slow Public EVSE Deployment Forecast 2016-2026 & Analysis
4.5.2.3. Canada Public Fast EVSE Deployment Forecast 2016-2026: A Majority of the EVSE Units Operating Free of Charge
4.5.2.4. Canada EVSE Market Share Summary 2016, 2021, 2026: Private Chargers Set to Dominate
4.5.2.5. Learn Which Provinces Support EVSE Development and How
4.5.3. France Targets 7ml Chargers by 2030, can it be done?
4.5.3.1. France Private EVSE Deployment Forecast 2016-2026 & Prospects
4.5.3.2. France Public Slow EVSE Deployment Forecast 2016-2026: A Charger Every 25 miles
4.5.3.3. France Public Fast EVSE Deployment Forecast 2016-2026
4.5.3.4. France EVSE Market Share Summary to Change Drastically from 2016 to 2021 to 2026
4.5.3.5. French Grant and Swap Incentives
4.5.4. German Charging Infrastructure Market
4.5.4.1. Germany Private EVSE Stock Deployment Forecast 2016-2026 & Analysis
4.5.4.2. Germany Public Slow EVSE Deployment Forecast Outlook 2016-2026
4.5.4.3. Germany Public Fast EVSE Deployment Forecast 2016-2026: A Two-stage Plan
4.5.4.4. Germany EVSE Market Share Summary 2016, 2021, 2026: Public Chargers on the Rise
4.5.4.5. 1 Billion Euros for EVs and EVSE purchases
4.5.5. Italian EVSE Grows Slower than Expected
4.5.5.1. Italy Private EVSE Stock Deployment Forecast Outlook 2016-2026
4.5.5.2. Italy Public Slow EVSE Deployment Forecast 2016-2026 & Analysis
4.5.5.3. Italy Public Fast EVSE Deployment Forecast 2016-2026
4.5.5.4. Italy EVSE Market Share Summary 2016, 2021, 2026: Private Chargers to Lose Their Share
4.5.5.5. Incentives via Ownership Tax
4.5.6. Netherlands - No ICE Car Sales from 2025
4.5.6.1. Netherlands Private EVSE Stock Deployment Forecast 2016-2026 & Prospects
4.5.6.2. Netherlands Public Slow EVSE Deployment Forecast Outlook 2016-2026
4.5.6.3. Netherlands Public Fast EVSE Deployment Forecast 2016-2026 & Analysis
4.5.6.4. Netherlands EVSE Market Share Summary 2016, 2021, 2026: Planned Balance
4.5.6.5. Incentives on All Levels
4.5.7. Norway - All New Cars Emission-Free by 2025
4.5.7.1. Norway Private EVSE Stock Deployment Outlook 2016-2026
4.5.7.2. Norway Public Slow EVSE Deployment Forecast 2016-2026 & Analysis
4.5.7.3. Norway Public Fast EVSE Deployment Forecast 2016-2026: An EVSE Every 50km
4.5.7.4. Norway EVSE Market Share Summary: Market Shares to Remain Intact Throughout Forecast Period
4.5.7.5. Small Country - Big Incentives
4.5.8. Sweden to Be an Oil-Free Nation by 2030
4.5.8.1Sweden Private EVSE Deployment Outlook 2016-2026
4.5.8.2. Sweden Public Slow EVSE Deployment Forecast 2016-2026
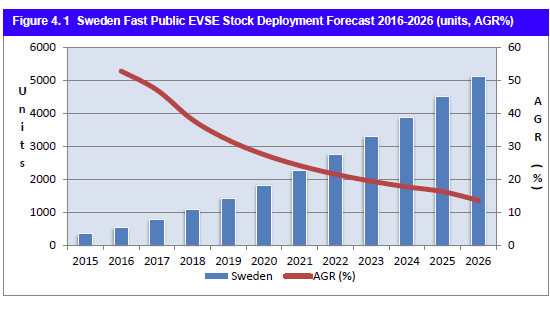
4.5.8.3. Sweden Public Fast EVSE Deployment Forecast 2016-2026 & Analysis
4.5.8.4. Sweden EVSE Market Share Summary 2016, 2021, 2026
4.5.8.5. Taxes and Rebates
4.5.9. UK to Have Fully Electrified Road Network by 2040
4.5.9.1. UK Private EVSE Deployment Forecast 2016-2026 & Prospects
4.5.9.2. UK Public Slow EVSE Deployment Outlook 2016-2026
4.5.9.3. UK Public Fast EVSE Deployment Forecast 2016-2026: To Grow Fastest Among Other Chargers
4.5.9.4. UK EVSE Market Share Summary 2016, 2021, 2026
4.5.9.5. Support on All Levels
4.5.10. Russia Lays the Infrastructure First
4.5.10.1. Russia Private EVSE Stock Deployment Forecast 2016-2026
4.5.10.2. Public Slow EVSE Expected to Jump 40,000% in 1 Year - Is This Realistic?
4.5.10.3. Russia Public Fast EVSE Deployment Outlook 2016-2026
4.5.10.4. Russia EVSE Market Share Summary 2016, 2021, 2026
4.5.10.5. Government Mandate and Promotion of E-mobility
4.5.11. China is an Asian Tiger in EVSE
4.5.11.1. China Private EVSE Deployment Outlook 2016-2026
4.5.11.2. China Public Slow Chargers Deployment Forecast 2016-2026
4.5.11.3. China Public Fast EVSE Deployment Forecast 2016-2026
4.5.11.4. China EVSE Market Share Summary 2016, 2021, 2026: Private Chargers to Grow
4.5.11.5. EV Special treatment
4.5.12. India Charging Infrastructure Market
4.5.12.1. India Private EVSE Deployment Forecast 2016-2026 & Prospects
4.5.12.2. India Public Slow EVSE Deployment Outlook 2016-2026
4.5.12.3. India Public Fast EVSE Deployment Forecast 2016-2026 & Analysis
4.5.12.4. India EVSE Market Share Summary 2016, 2021, 2026: Market Landscape Will Change
4.5.12.5. Four and Two Wheelers' Incentives
4.5.13. Japan Now Has More Charging Points than Gas Stations
4.5.13.1. Japan Private EVSE Deployment Outlook 2016-2026
4.5.13.2. Japan Public Slow EVSE Deployment Forecast 2016-2026
4.5.13.3. Japan Public Fast Chargers Deployment Forecast 2016-2026
4.5.13.4. Japan EVSE Market Share Summary 2016, 2021, 2026
4.5.13.5. No Need to Incentivise
4.5.14. S. Korea EVSE Market Forecast 2016-2026
4.5.14.1. S. Korea Private EVSE Deployment Prospects for 2016-2026
4.5.14.2. S. Korea Public Slow EVSE Deployment Outlook 2016-2026
4.5.14.3. S. Korea Public Fast EVSE Deployment Forecast 2016-2026
4.5.14.4. S. Korea EVSE Market Share Summary 2016, 2021, 2026
4.5.14.5. All EV Funding Comes From S. Korean Government
4.5.15. S. Africa Charging Infrastructure Market Forecast 2016-2026
4.5.15.1. S. Africa Private EVSE Stock Deployment Forecast 2016-2026
4.5.15.2. S. Africa Public Slow EVSE Deployment Forecast 2016-2026
4.5.15.3. S. Africa Public Fast EVSE Deployment Forecast 2016-2026
4.5.15.4. S. Africa EVSE Market Share Summary 2016, 2021, 2026
4.5.15.5. Automakers Partner with Government
5. PESTEL Analysis Fused with Opportunities and Threats of the Global EV Charging Infrastructure Market
6. Experts' Opinion
6.1. ClipperCreek
6.1.1. ClipperCreek Discusses their Charging Station Products
6.1.2. ClipperCreek's View on Future Electric Vehicle Market Development
6.1.3. ClipperCreek for Level 1, Level 2 and Level 3 Charging Stations
6.1.4. ClipperCreek for Public and in House Electric Vehicle Charging Stations Installations
6.1.5. ClipperCreek for Tesla's Charging Stations and North America EVCS Standards
6.1.6. ClipperCreek's Upcoming Products
6.1.7. ClipperCreek's Vision
7. Leading Companies in EVSE Market
7.1. Liberty Plugins
7.1.1. HYDRA-R Multi-Charger Control System
7.1.2. HYDRA-RX High Power Charger Control System
7.2. Chargemaster PLC
7.2.1. Business Charging Stations
7.2.2. Rapid Charging
7.2.3. Home Charging
7.2.4. Workplace Charging
7.3. ClipperCreek
7.4. NRG EVgo
7.4.1. EVgo Home Charging Solutions
7.4.2. EVgo Workplace Charging Solutions
7.4.3. EVgo Charge away from Home
7.5. ChargePoint
7.5.1. ChargePoint Home
7.5.2. ChargePoint Smart Charging Stations
7.6. FullCharger
7.6.1. Compact Charging Station
7.6.2. Compact Mini Charging Station
7.6.3. Twin Charging Station
7.6.4. EVe Charging Station
7.6.5. Tube Charging Station
7.6.6. Quick Charging Station
7.7. Elektromotive
7.7.1. Elektrobay Charging Station Range
7.8. Bosch Automotive Service Solutions Inc
7.8.1. Power Xpress
7.8.2. Power Max
7.8.3. Power Max 2 and 2Plus
7.8.4. Power Xpress Bollards
7.8.5. Power DC Plus
7.9. Circontrol
7.9.1. WallBox
7.9.2. Charging Posts
7.9.3. Multipoint
7.9.4. Quick Charge
7.10. Tesla Motors
7.10.1. Tesla Supercharger
7.11. Siemens
7.11.1. VersiCharge and VersiCharge SG Residential Charger
7.12. General Electric
7.12.1. WattStation and DuraStation
7.13. Schneider Electric
7.13.1. Schneider EVLink Family Chargers
7.14. AeroVironment
7.14.1. TurboDock
7.14.2. TurboCord
7.14.3. EVSE RS
7.15. Leviton
7.15.1. Leviton Charging Station Range
7.16. Other Leading Companies
8. Conclusions
8.1. Charging Infrastructure Market Trends
8.2. Implications
8.2.1. EV OEMs and Suppliers
8.2.2. Charging Infrastructure
8.2.3. Grid
8.2.4. New Business Models
9. Glossary
9.1.Standards
List of Tables
Table 1.1: Electric Vehicle Charging Levels (miles per time charge, connector, description)
Table 1.2: Factors that drive the demand of EV Charging Stations
Table 2.1: Categories of Electric Vehicle Charging
Table 2.2: Electric Vehicle Charging Levels (miles per time charge, connector, description)
Table 2.3: SAE Standards for EV Charging (AC Charging Level, DC Charging Level, Specs)
Table 2.4: Modes of Electric Vehicle Charging
Table 2.5: Connection Cases Associated with the Modes of Electric Vehicle Charging
Table 2.6: Types of Plugs Used for EV Charging
Table 2.7: Car Model Compatibility with Charging Plugs/Cables
Table 2.8: Charging Time Under Different Charging Conditions (kW, V, AC/DC, A, min)
Table 2.9: Utility Charging Stations Actions
Table 2.10: Government Charging Stations Actions
Table 2.11: Automakers Charging Stations Actions
Table 3.1: Global EV Charging Infrastructure Market Forecast 2016-2026 (Units, AGR%, CAGR%)
Table 3.2: Electric Vehicles Global Sales Forecast 2015-2025 Sales in million Units, AGR(%), CAGR(%)
Table 3.3: EVSE Deployment Costs: Low Cost and High Cost Scenario (USD)
Table 3.4: Low Cost Scenario of EVSE Deployment in USD
Table 3.5: High Cost Scenario of EVSE Deployment in USD
Table 3.6: EVCS Deployment Costs Difference Between High and Low Cost Scenario ($US, %)
Table 3.7: Global EVSE Stock Deployment by Charging Type 2005-2015 (Private, Slow and Fast in millions, AGR %)
Table 3.8: Global EVSE Stock Deployment 2016-2026 (units, AGR %, CAGR %)
Table 3.9: Global EVSE Stock Deployment by Charging Type (private, slow and fast, AGR %)
Table 3.10: Global Private EVSE Stock Deployment 2016-2026 (units, AGR %, CAGR %)
Table 3.11: Global Public Slow Chargers Stock Deployment 2016-2026 (units, AGR %, CAGR %)
Table 3.12: Global Public Fast Chargers Stock Deployment 2016-2026 (units, AGR %, CAGR %)
Table 4.1: National EVSE Stock Deployment Forecast 2016-2026 (Units, AGR %)
Table 4.2: National Private EVSE Stock Market Forecast 2016-2026 (Units, AGR %)
Table 4.3: National Slow Public EVSE Stock Deployment Forecast 2016-2026 (Units, AGR %)
Table 4.4: National Fast Public EVSE Stock Deployment Forecast 2016-2026 (Units, AGR%)
Table 4.5: US Total EVSE Stock Deployment Forecast 2016-2026 (Units, AGR%, CAGR%)
Table 4.6: US Private EVSE Stock Deployment Forecast 2016-2026 (Units, AGR%, CAGR%)
Table 4.7: US Slow Public EVSE Stock Deployment Forecast 2016-2026 (units, AGR%, CAGR%)
Table 4.8: US Fast Public EVSE Stock Deployment Forecast 2016-2026 (units, AGR%, CAGR%)
Table 4.9: Summarized Key Experiences of US EVSE Consumers
Table 4.10: Summary of Federal and State EVSE Installation Incentives
Table 4.11: Canada Total EVSE Stock Deployment Forecast 2016-2026 (units, AGR%, CAGR%)
Table 4.12: Canada Private EVSE Stock Deployment Forecast 2016-2026 (units, AGR%, CAGR%)
Table 4.13: Canada Slow Public EVSE Stock Deployment Forecast 2016-2026 (units, AGR%, CAGR%)
Table 4.14: Canada Fast Public EVSE Stock Deployment Forecast 2016-2026 (units, AGR%, CAGR%)
Table 4.15: Summary of EVSE Installation Incentives by Province
Table 4.16: France Total EVSE Stock Deployment Forecast 2016-2026 (units, AGR%, CAGR%)
Table 4.17: France Private EVSE Stock Deployment Forecast 2016-2026 (units, AGR%, CAGR%)
Table 4.18: France Slow Public EVSE Stock Deployment Forecast 2016-2026 (units, AGR%, CAGR%)
Table 4.19: France Fast Public EVSE Stock Deployment Forecast 2016-2026 (units, AGR%, CAGR%)
Table 4.20: Germany Total EVSE Stock Deployment Forecast 2016-2026 (units, AGR%, CAGR%)
Table 4.21: Germany Private EVSE Stock Deployment Forecast 2016-2026 (units, AGR%, CAGR%)
Table 4.22: Germany Slow Public EVSE Stock Deployment Forecast 2016-2026 (units, AGR%, CAGR%)
Table 4.23: Germany Fast Public EVSE Stock Deployment Forecast 2016-2026 (units, AGR%, CAGR%)
Table 4.24: German EV and EVSE Purchase Incentives
Table 4.25: Italy Total EVSE Stock Deployment Forecast 2016-2026 (units, AGR%, CAGR%)
Table 4.26: Italy Private EVSE Stock Deployment Forecast 2016-2026 (units, AGR%, CAGR%)
Table 4.27: Italy Slow Public EVSE Stock Deployment Forecast 2016-2026 (units, AGR%, CAGR%)
Table 4.28: Italy Fast Public EVSE Stock Deployment Forecast 2016-2026 (units, AGR%, CAGR%)
Table 4.29: Italian EV and EVSE Incentives
Table 4.30: Netherlands Total EVSE Stock Deployment Forecast 2016-2026 (units, AGR%, CAGR%)
Table 4.31: Netherlands Private EVSE Stock Deployment Forecast 2016-2026 (units, AGR%, CAGR%)
Table 4.32: Netherlands Slow Public EVSE Stock Deployment Forecast 2016-2026 (units, AGR%, CAGR%)
Table 4.33: Summary of EVSE Installation Incentives by Authority
Table 4.34: Norway Total EVSE Stock Deployment Forecast 2016-2026 (units, AGR%, CAGR%)
Table 4.35: Norway Private EVSE Stock Deployment Forecast 2016-2026 (units, AGR%, CAGR%)
Table 4.36: Norway Slow Public EVSE Stock Deployment Forecast 2016-2026 (units, AGR%, CAGR%)
Table 4.37: Norway Fast Public EVSE Stock Deployment Forecast 2016-2026 (units, AGR%, CAGR%)
Table 4.38: Summary of EVSE Installation Incentives by Incentive
Table 4.39: Sweden Total EVSE Stock Deployment Forecast 2016-2026 (units, AGR%, CAGR%)
Table 4.40: Sweden Private EVSE Stock Deployment Forecast 2016-2026 (units, AGR%, CAGR%)
Table 4.41: Sweden Slow Public EVSE Stock Deployment Forecast 2016-2026 (units, AGR%, CAGR%)
Table 4.42: Sweden Fast Public EVSE Stock Deployment Forecast 2016-2026 (units, AGR%, CAGR%)
Table 4.43: UK Total EVSE Stock Deployment Forecast 2016-2026 (units, AGR%, CAGR%)
Table 4.44: UK Private EVSE Stock Deployment Forecast 2016-2026 (units, AGR%, CAGR%)
Table 4.45: UK Slow Public EVSE Stock Deployment Forecast 2016-2026 (units, AGR%, CAGR%)
Table 4.46: UK Fast Public EVSE Stock Deployment Forecast 2016-2026 (units, AGR%, CAGR%)
Table 4.47: Russia Total EVSE Stock Deployment Forecast 2016-2026 (units, AGR%, CAGR%)
Table 4.48: Russia Private EVSE Stock Deployment Forecast 2016-2026 (units, AGR%, CAGR%)
Table 4.49: Russia Slow Public EVSE Stock Deployment Forecast 2016-2026 (units, AGR%, CAGR%)
Table 4.50: Russia Fast Public EVSE Stock Deployment Forecast 2016-2026 (units, AGR%, CAGR%)
Table 4.51: China Total EVSE Stock Deployment Forecast 2016-2026 (units, AGR%, CAGR%)
Table 4.52: China Private EVSE Stock Deployment Forecast 2016-2026 (units, AGR%, CAGR%)
Table 4.53: China Slow Public EVSE Stock Deployment Forecast 2016-2026 (units, AGR%, CAGR%)
Table 4.54: China Fast Public EVSE Stock Deployment Forecast 2016-2026 (units, AGR%, CAGR%)
Table 4.55: Summary of EV purchase Incentives
Table 4.56: Summary of EVSE Deployment Incentives
Table 4.57: India Total EVSE Stock Deployment Forecast 2016-2026 (units, AGR%, CAGR%)
Table 4.58: India Private EVSE Stock Deployment Forecast 2016-2026 (units, AGR%, CAGR%)
Table 4.59: India Slow Public EVSE Stock Deployment Forecast 2016-2026 (units, AGR%, CAGR%)
Table 4.60: India Fast Public EVSE Stock Deployment Forecast 2016-2026 (units, AGR%, CAGR%)
Table 4.61: Summary of EV purchase Incentives
Table 4.62: Japan Total EVSE Stock Deployment Forecast 2016-2026 (units, AGR%, CAGR%)
Table 4.63: Japan Private EVSE Stock Deployment Forecast 2016-2026 (units, AGR%, CAGR%)
Table 4.64: Japan Slow Public EVSE Stock Deployment Forecast 2016-2026 (units, AGR%, CAGR%)
Table 4.65: Japan Fast Public EVSE Stock Deployment Forecast 2016-2026 (units, AGR%, CAGR%)
Table 4.66: S. Korea Total EVSE Stock Deployment Forecast 2016-2026 (units, AGR%, CAGR%)
Table 4.67: S. Korea Private EVSE Stock Deployment Forecast 2016-2026 (units, AGR%, CAGR%)
Table 4.68: S. Korea Slow Public EVSE Stock Deployment Forecast 2016-2026 (units, AGR%, CAGR%)
Table 4.69: S. Korea Fast Public EVSE Stock Deployment Forecast 2016-2026 (units, AGR%, CAGR%)
Table 4.70: S. Africa Total EVSE Stock Deployment Forecast 2016-2026 (units, AGR%, CAGR%)
Table 4.71: S. Africa Private EVSE Stock Deployment Forecast 2016-2026 (units, AGR%, CAGR%)
Table 4.72: S. Africa Slow Public EVSE Stock Deployment Forecast 2016-2026 (units, AGR%, CAGR%)
Table 4.73: S. Africa Fast Public EVSE Stock Deployment Forecast 2016-2026 (units, AGR%, CAGR%)
Table 5.1: PESTEL Analysis Fused with Opportunities and Threats of the EV Charging Infrastructure Market
Table 7.1: Level 1 - 120V, 12A+ (1.4kW-2.4kW) Charging, ACS-20
Table 7.2: Level 2 - 240V, 40A+ (9.6kW-19.2kW) Charging, HCS-50
Table 7.3: Level 2 - 240V, 12A-15A (2.8kW-3.6kW) Charging, LCS-20
Table 7.4: Level 2 - 240V, 24A-32A (5.7kW-7.7kW) Charging
Table 7.5: Level 2 EVgo Charger Compared to Standard Outlet
Table 7.6: Chargepoint Home Charging Station Technical Specifications
Table 7.7: Chargepoint CT, CPE and CPF Station Families Comparison
Table 7.8: Compact Charger Technical Specification
Table 7.9: Twin Charger Technical Specification
Table 7.10: Tube Charger Technical Specification
Table 7.11: Quick Charging Station Technical Specification
Table 7.12: Elektrobay Charging Stations Range Technical Specification
Table 7.13: Bosch Power Xpress Charging Stations Range Technical Specification
Table 7.14: Bosch Power Max Charging Stations Range Technical Specification
Table 7.15: Bosch Power Max 2 and 2Plus Charging Stations Range Technical Specification
Table 7.16: Bosch Power Xpress Bollards Charging Stations Range Technical Specification
Table 7.17: Bosch Power DC Plus Charging Stations Range Technical Specification
Table 7.18: Circontrol WallBox Range Charging Stations Technical Specifications
Table 7.19: Circontrol Charging Posts Range Charging Stations Technical Specifications
Table 7.20: Circontrol Multipoint Solutions Technical Specifications
Table 7.21: Circontrol Quick Charge Stations Technical Specifications
Table 7.22: Siemens Income Statement Summary 2011-2015 (all in $ml, except EPS)
Table 7.23: VersiCharge and VersiCharge SG (Smart Grid) Technical Specifications
Table 7.24: GE Income Statement Summary 2011-2015 (all in $ml, except EPS)
Table 7.25: WattStation and DuraStation Technical Specifications
Table 7.26: Schneider Electric Income Statement Summary 2011-2015 (all in $ml, except EPS)
Table 7.27: EVLink Family Chargers Technical Specifications
Table 7.28: AeroVironment Income Statement Summary 2011-2015 (all in $ml, except EPS)
Table 7.29: TurboDock Charger Technical Specifications
Table 7.30: TurboCord Charging Time 120V vs 240V by Car Make and Model
Table 7.31: Leviton Charging Station Range Technical Specifications
Table 7.32: Other Leading Companies in Charging Infrastructure Market
List Figures
Figure 2.1: Modes of Electric Vehicle Charging
Figure 2.2: Types of Plugs Used for EV Charging
Figure 2.3: Locations of Public Chargers Installation
Figure 2.4: Solar EV Charging Station in Illinois
Figure 2.5: Segmentation of the EV Charging Infrastructure Market
Figure 3.1: Global EV Charging Infrastructure Market Forecast 2016-2026 (Units stock in millions, AGR%)
Figure 3.2: EVSE Cost for Level 2 Home, Garage Parking, Curb Side and DC Charging (Low Cost Scenario in USD)
Figure 3.3: Global EVSE Stock Deployment 2016-2026 (in millions units, AGR %)
Figure 3.4: Charging Type Submarkets Share Summary in % (private, slow and fast)
Figure 3.5: Global Private EVSE Stock Deployment 2016-2026 (in millions units, AGR %)
Figure 3.6: Private chargers Market Share Summary in % 2016, 2021, 2026
Figure 3.7: Global Public Slow Chargers Stock Deployment 2016-2026 (in millions units, AGR %)
Figure 3.8: Public Slow Chargers Market Share Summary in % 2016, 2021, 2026
Figure 3.9: Global Public Fast Chargers Stock Deployment 2016-2026 (in millions units, AGR %)
Figure 3.10: Public Fast Chargers Market Share Summary in % 2016, 2021, 2026
Figure 4.1: National EVSE Stock Deployment Share Summary in % 2016, 2021, 2026
Figure 4.2: National Private EVSE Stock Deployment Forecast 2016-2026 (Units in millions, AGR %)
Figure 4.3: National Private EVSE Stock Market Share Summary in % 2016, 2021, 2026
Figure 4.4: National Slow Public EVSE Stock Deployment Forecast 2016-2026 (Units in thousands, AGR %)
Figure 4.5: National Slow Public EVSE Stock Deployment Share Summary in % 2016, 2021, 2026
Figure 4.6: National Fast Public EVSE Stock Deployment Forecast 2016-2026 (Units in thousands, AGR%)
Figure 4.7: National Fast Public EVSE Stock Market Share Summary in % 2016, 2021, 2026
Figure 4.8: US Total EVSE Stock Deployment Forecast 2016-2026 (ml units, AGR%)
Figure 4.9: US Private EVSE Stock Deployment Forecast 2016-2026 (ml units, AGR%)
Figure 4.10: US Slow Public EVSE Stock Deployment Forecast 2016-2026 (units, AGR%)
Figure 4.11: US Fast Public EVSE Stock Deployment Forecast 2016-2026 (units, AGR%)
Figure 4.12: Drivers for demand for EVSE in the US Market
Figure 4.13: Reasons that will Drive the Demand for EVSEs in US
Figure 4.14: Canada Total EVSE Stock Deployment Forecast 2016-2026 (units, AGR%)
Figure 4.15: Canada Private EVSE Stock Deployment Forecast 2016-2026 (ml units, AGR%)
Figure 4.16: Canada Slow Public EVSE Stock Deployment Forecast 2016-2026 (units, AGR%)
Figure 4.17: Canada Fast Public EVSE Stock Deployment Forecast 2016-2026 (units, AGR%)
Figure 4.18: Canada EVSE Market Share Summary in % 2016, 2021, 2026
Figure 4.19: Drivers of EVSE Deployment in Canada
Figure 4.20: France Total EVSE Stock Deployment Forecast 2016-2026 (units, AGR%)
Figure 4.21: France Private EVSE Stock Deployment Forecast 2016-2026 (ml units, AGR%)
Figure 4.22: France Slow Public EVSE Stock Deployment Forecast 2016-2026 (units, AGR%)
Figure 4.23: France Fast Public EVSE Stock Deployment Forecast 2016-2026 (units, AGR%)
Figure 4.24: France EVSE Market Share Summary in % 2016, 2021, 2026
Figure 4.25: Germany Total EVSE Stock Deployment Forecast 2016-2026 (units, AGR%)
Figure 4.26: Germany Private EVSE Stock Deployment Forecast 2016-2026 (units, AGR%)
Figure 4.27: Germany Slow Public EVSE Stock Deployment Forecast 2016-2026 (units, AGR%)
Figure 4.28: Germany Fast Public EVSE Stock Deployment Forecast 2016-2026 (units, AGR%)
Figure 4.29: Germany EVSE Market Share Summary in % 2016, 2021, 2026
Figure 4.30: Italy Total EVSE Stock Deployment Forecast 2016-2026 (units, AGR%)
Figure 4.31: Italy Private EVSE Stock Deployment Forecast 2016-2026 (units, AGR%)
Figure 4.32: Italy Slow Public EVSE Stock Deployment Forecast 2016-2026 (units, AGR%)
Figure 4.33: Italy Fast Public EVSE Stock Deployment Forecast 2016-2026 (units, AGR%)
Figure 4.34: Italy EVSE Market Share Summary in % 2016, 2021, 2026
Figure 4.35: Netherlands Total EVSE Stock Deployment Forecast 2016-2026 (units, AGR%)
Figure 4.36: Netherlands Private EVSE Stock Deployment Forecast 2016-2026 (units, AGR%)
Figure 4.37: Netherlands Slow Public EVSE Stock Deployment Forecast 2016-2026 (units, AGR%)
Figure 4.38: Netherlands Fast Public EVSE Stock Deployment Forecast 2016-2026 (units, AGR%, CAGR%)
Figure 4.39: Netherlands Fast Public EVSE Stock Deployment Forecast 2016-2026 (units, AGR%)
Figure 4.40: Netherlands EVSE Market Share Summary in % 2016, 2021, 2026
Figure 4.41: Norway Total EVSE Stock Deployment Forecast 2016-2026 (units, AGR%)
Figure 4.42: Norway Private EVSE Stock Deployment Forecast 2016-2026 (units, AGR%)
Figure 4.43: Norway Slow Public EVSE Stock Deployment Forecast 2016-2026 (units, AGR%)
Figure 4.44: Norway Fast Public EVSE Stock Deployment Forecast 2016-2026 (units, AGR%)
Figure 4.45: Norway EVSE Market Share Summary in % 2016, 2021, 2026
Figure 4.46: Sweden Total EVSE Stock Deployment Forecast 2016-2026 (units, AGR%)
Figure 4.47: Sweden Private EVSE Stock Deployment Forecast 2016-2026 (units, AGR%)
Figure 4.48: Sweden Slow Public EVSE Stock Deployment Forecast 2016-2026 (units, AGR%)
Figure 4.49: Sweden Fast Public EVSE Stock Deployment Forecast 2016-2026 (units, AGR%)
Figure 4.50: Sweden EVSE Market Share Summary in % 2016, 2021, 2026
Figure 4.51: UK Total EVSE Stock Deployment Forecast 2016-2026 (units, AGR%)
Figure 4.52: UK Private EVSE Stock Deployment Forecast 2016-2026 (units, AGR%)
Figure 4.53: UK Slow Public EVSE Stock Deployment Forecast 2016-2026 (units, AGR%)
Figure 4.54: UK Fast Public EVSE Stock Deployment Forecast 2016-2026 (units, AGR%)
Figure 4.55: UK EVSE Market Share Summary in % 2016, 2021, 2026
Figure 4.56: Russia Total EVSE Stock Deployment Forecast 2016-2026 (units, AGR%)
Figure 4.57: Russia Private EVSE Stock Deployment Forecast 2016-2026 (units, AGR%)
Figure 4.58: Russia Slow Public EVSE Stock Deployment Forecast 2016-2026 (units, AGR%)
Figure 4.59: Russia Fast Public EVSE Stock Deployment Forecast 2016-2026 (units, AGR%)
Figure 4.60: Russia EVSE Market Share Summary in % 2016, 2021, 2026
Figure 4.61: China Total EVSE Stock Deployment Forecast 2016-2026 (units, AGR%)
Figure 4.62: Drivers of Demand for EVSE in China
Figure 4.63: China Private EVSE Stock Deployment Forecast 2016-2026 (units, AGR%)
Figure 4.64: China Slow Public EVSE Stock Deployment Forecast 2016-2026 (units, AGR%)
Figure 4.65: China Fast Public EVSE Stock Deployment Forecast 2016-2026 (units, AGR%)
Figure 4.66: China EVSE Market Share Summary in % 2016, 2021, 2026
Figure 4.67: India Total EVSE Stock Deployment Forecast 2016-2026 (units, AGR%)
Figure 4.68: India Private EVSE Stock Deployment Forecast 2016-2026 (units, AGR%)
Figure 4.69: India Slow Public EVSE Stock Deployment Forecast 2016-2026 (units, AGR%)
Figure 4.70: India Fast Public EVSE Stock Deployment Forecast 2016-2026 (units, AGR%)
Figure 4.71: India EVSE Market Share Summary in % 2016, 2021, 2026
Figure 4.72: Japan Total EVSE Stock Deployment Forecast 2016-2026 (units, AGR%)
Figure 4.73: Japan Private EVSE Stock Deployment Forecast 2016-2026 (units, AGR%)
Figure 4.74: Japan Slow Public EVSE Stock Deployment Forecast 2016-2026 (units, AGR%)
Figure 4.75: Japan Fast Public EVSE Stock Deployment Forecast 2016-2026 (units, AGR%)
Figure 4.76: Japan EVSE Market Share Summary in % 2016, 2021, 2026
Figure 4.77: S. Korea Total EVSE Stock Deployment Forecast 2016-2026 (units, AGR%)
Figure 4.78: S. Korea Private EVSE Stock Deployment Forecast 2016-2026 (units, AGR%)
Figure 4.79: S. Korea Slow Public EVSE Stock Deployment Forecast 2016-2026 (units, AGR%)
Figure 4.80: S. Korea Fast Public EVSE Stock Deployment Forecast 2016-2026 (units, AGR%)
Figure 4.81: S. Korea EVSE Market Share Summary in % 2016, 2021, 2026
Figure 4.82: S. Africa Total EVSE Stock Deployment Forecast 2016-2026 (units, AGR%)
Figure 4.83: S. Africa Private EVSE Stock Deployment Forecast 2016-2026 (units, AGR%)
Figure 4.84: S. Africa Slow Public EVSE Stock Deployment Forecast 2016-2026 (units, AGR%)
Figure 4.85: S. Africa Fast Public EVSE Stock Deployment Forecast 2016-2026 (units, AGR%)
Figure 4.86: S. Africa EVSE Market Share Summary in % 2016, 2021, 2026
Figure 7.1: HYDRA-R Multi-Charger Control System
Companies Listed
ABB Group
AddEnergie
Advanced Energy
AeroVironment
Aker Wade
Alpha Energy
Andromeda Power
APC
ASDA
Audi
Avcon
AvtoVAZ
Better Place
Blink Network
BMW
Bosch Automotive Service Solutions
Burbank Water and Power
BYD
Car Charging Group
Cenex
Charge Star
ChargeIQ
Chargemaster
ChargeNow
ChargePoint
China State Grid
Circontrol
ClipperCreek
Control Module Industries
Coulomb
Daimler
DBT USA
Delta Electronics
Duke Energy
Eaton Corporation
ECOtality North America
Ecotricity
Electromotive
Elmec
eMotorWerks
EnBW
Energy Saving Trust
EON
Erg-Go
E-Station
E-Totem
Etrel
EV Box
EV Connect
EVACEC
EV-Charge America
EVergreen Time to Charge
Evoasis
EVoCharge
E-Volt
EVSE LLC
EVSEUpgrade
EVTronic
EyeOnPower
Family Mart
Ford
Fuji Electric
FullCharger
General Electric
General Motors
GoSmart - ChargeSpot
Green Charge Networks
GRIDbot
Gridscape Solutions
HaloIPT (Now owned by Qualcomm)
Hangar 19
HomePlug
IKEA
Indianapolis Power & Light Company
Itron
JuiceBar
Kandi Technologies Group
Lear (OEM for General Motors)
Legrand Canada
Leviton
Liberty Plugins
Madison Gas and Electric
McDonalds
Mitsubishi
Nissan
Nissan South Africa
NRG Evgo
Optimization Technologies (OpConnect)
Park & Charge
Park and Power
Parkpod
Pelco
Pep Stations
Peugeot
Pininfarinia
Plug Smart (Intelligence for GE Charging Stations)
Plugless Power
Porsche
Progress Energy
Puget Sound Energy
Qualcomm
Rabobank
Renault ZE
Rolec Services
RWE AG
Sainsbury
Sacramento Municipal Utility District
Schneider Electric
Seaward Group
SemaConnect
Shorepower
Siemens
Signet Systems
SolarCity
SPX Service Solutions
Square D
Tesla
Tim Horton's restaurants
Toyota
Urban Foresight
Urban Green Energy
Valent Power
Vattenfall,
Vauxhall
Volkswagen
Volvo
Waitrose
Wattmobile
WiTricity
Yazaki
Agencies and Other Organisations Mentioned in this Report
According to Society of Automotive Engineers (SAE)
Anaheim Public Utilities
Association of German Engineers
Consumer Electronics Association (CEA)
Danish Agency for Energy
Dutch Ministry of Infrastructure and the Environment
European Commission (EC)
Federal Ministry of Transport, Building and Urban Development (BMVBS)
Fraser Basin Council
French Ministry of Environment
International Electrotechnical Commission (IEC)
Japan Ministry of Economy
Korea Advanced Institute of Science and Technology (KAIST)
Los Angeles Department of Water & Power
Maryland Energy Administration
Massachusetts Department of Environmental Protection
NEMA
Office for Low Emission Vehicles (OLEV)
S. Korean Ministry of Trade, Industry and Energy
South Korea Ministry of Strategy and Finance
South Korea Ministry of the Environment
Transport Scotland
U.S. Department of Energy's Alternative Fuel
University of Delaware
US Department of Energy
Utility and Transportation Commission
ZigBee Alliance
http://www.bimarket.cn/Report/ReportInfo.aspx?Id=25875