|
|
Index>>Economy&Goods>>Agriculture
|
China Aquatic Product Processing Industry Report, 2008 |
 |
The pre-sale reports, which are not in full form but already have data support,
are available within five working days after purchase.
|
|
ReportCode: |
Hard Copy  |
USD $ 1,700 |
 |
Electronic(PDF)  |
USD $ 1,800 |
 |
Enterprisewide  |
USD $ 2,700 |
 |
|
|
|

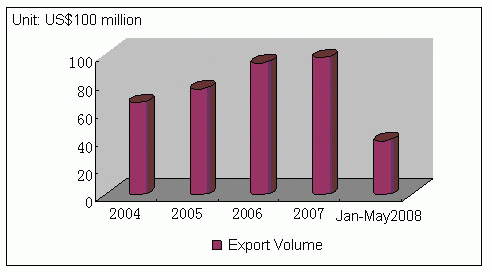
Aquatic product export of china has maintained a rapid growth in the recent years. Up to May 2008, China aquatic product export value has reached US $3.84 billion.
Export Value of China Aquatic Products, 2004-May 2008

Source: ResearchInChina
The output of China aquatic product processing has increased continuously, as well as the growth rate of output value. Meanwhile, the sales revenue also has maintained sustained growth. However, the whole industry is featured as out-of-date processing techniques, low utilization rate and low added value.
According to The Ministry of Agriculture, by the end of 2010, the output of aquatic product will reach 60 million tons with an average annual growth rate of 3.3%; the output Value of fishery industry will reach CNY 570 billion with an average annual growth rate of 6.4%.
|

1. China Aquatic Product Industry Development
1.1 Overview
1.1.1 Development Status
1.1.2 Distribution Status
1.1.3 Global Aquatic Product Industry Overview
1.2 China Aquatic Product Market Status, 2004-Jun, 2008
1.3 Problems and Counter Measures
1.3.1 Suggestions
1.4 Prospect
2. China Aquatic Product Processing Industry Development
2.1 Development Analysis
2.1.1 Review
2.1.2 Diversified Development
2.1.3 Development Priority
2.2 Regional Development
2.3.1 Fujian Province
2.3.2 Jiangsu Province
2.3.3 Hainan Province
2.3.4 Qingdao City
2.3.5 Penglai City
2.3.6 Weihai City
2.3 Problems and Counter Measures
3. Economic Statistics of China Aquatic Product Processing Industry
3.1 Statistics of Key Companies, 2007-2008
3.2 Statistics of Key Companies according to the Nature of Ownership, 2007-2008
3.3 Statistics of Key Companies according to Scale, 2007-2008
3.4 Statistics of key Companies according to Sales Revenue, 2007-2008
4. Import & Export
5. Key Companies
5.1 Dalian Zhangzidao Fishery Group Co., Ltd
5.1.1 Company Profile
5.1.2 Operations
5.1.3 Development Strategies
5.1.4 Prospect
5.2 Shandong Homey Aquatic Development Co., Ltd
5.3 Shandong Oriental Ocean Sci-Tech Co., Ltd
5.4 CNFC Overseas Fishery Co., Ltd
5.5 Hunan Dongting Aquaculture Co., Ltd
5.6 Shandong Zhonglu Oceanic Fisheries Co., Ltd
6. Conclusions
|

Number of Aquatic Product Processing Companies in China, 1H2008
Asset, Debt and Profit of China Aquatic Product Processing Industry, 1H2008
Revenue, Cost and Output Value of China Aquatic Product Processing Industry, 1H2008
Sales Expense and Tax of China Aquatic Product Processing Industry, 1H2008
Financial Cost and Management Cost of China Aquatic Product Processing Industry, 1H2008
Profitability of China Aquatic Product Processing Industry, 1H2008
Debt-paying Ability of China Aquatic Product Processing Industry, 1H2008
Number of Aquatic Product Processing Companies according to Scale, 1H2008
Number of Losing Aquatic Product Processing Companies according to Scale, 1H2008
Average Employees of Aquatic Product Processing Companies in China, 1H2008
Average Asset Per Capita of Aquatic Product Processing Companies in China, 1H2008
Average Sales Revenue Per Capita of Aquatic Product Processing Companies in China, 1H2008
Average Output Value Per Capital of Aquatic Product Processing Companies in China, 1H2008
Number of Aquatic Product Processing Companies in China according to the Nature of Ownership, 1H2008
Number of Losing Aquatic Product Processing Companies in China according to the Nature of Ownership, 1H2008
Average Employees of Aquatic Product Processing Companies in China according to the Nature of Ownership, 1H2008
Average Asset Per Capita of Aquatic Product Processing Companies in China according to the Nature of Ownership, 1H2008
Average Debt Per Capita of Aquatic Product Processing Companies in China according to the Nature of Ownership, 1H2008
Average Sales Revenue Per Capita of Aquatic Product Processing Companies in China according to the Nature of Ownership, 1H2008
Average Profit Per Capital of Aquatic Product Processing Companies in China according to the Nature of Ownership, 1H2008
Top Ten Regions according to Market Share, 1H2008
Profit Distribution of Top Ten Regions, 1H2008
Profitability of Dalian Zhangzidao Fishery Group Co., Ltd
Debt-paying Ability of Dalian Zhangzidao Fishery Group Co., Ltd
Profitability of Shandong Oriental Ocean Sci-Tech Co., Ltd
Debt-paying Ability of Shandong Oriental Ocean Sci-Tech Co., Ltd
Financial Result of Hunan Dongting Aquaculture Co., Ltd
Profitability of Hunan Dongting Aquaculture Co., Ltd
Debt-paying Ability of Hunan Dongting Aquaculture Co., Ltd
Profitability of CNFC Overseas Fishery Co., Ltd
Debt-paying Ability of CNFC Overseas Fishery Co., Ltd
|
|
|
|
|